

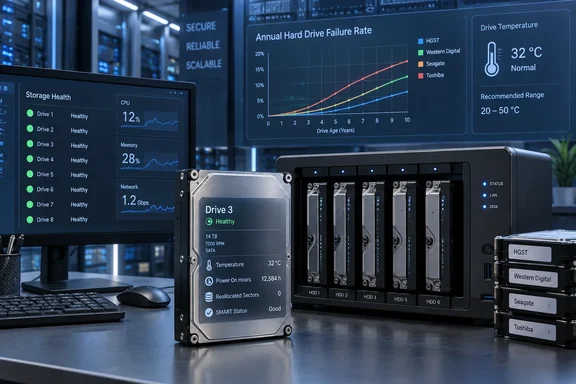
Researchers Christoph Siemroth and Yeomyung Park published “Are There Manufacturer Differences in Hard-Drive Reliability?” in IEEE Transactions on Cloud Computing. Their abstract, available through the University of Essex research repository, reports that HGST and Western Digital drives had substantially lower estimated failure rates than Seagate drives after accounting for several differences between the populations. Toshiba’s estimated failure rate was slightly higher than Seagate’s.
XDA Developers, which covered the research on September 22, describes a sample of approximately 443,000 drives operating between 2013 and the second quarter of 2025. That is substantial observational evidence. Translating it into “most drives last five to ten years,” however, goes further than the findings established by the available primary record.
Backblaze’s HDD records challenge a single replacement birthday
There are two related investigations behind this discussion, and they answer different questions. The 2026 academic paper compares manufacturers using Backblaze’s data. Backblaze’s own October 2025 analysis examines how the relationship between drive age and failure has changed across successive looks at its fleet.
The academic paper’s stated scope is short- to medium-term failure rates. Its researchers used two duration-regression models: statistical approaches for studying how the timing of failures relates to characteristics of the drives. The abstract says the manufacturer comparisons hold drive age, capacity, form factor, and temperature constant. That makes the results more useful than simply counting which manufacturer supplied the most failed disks.
Consider why those controls matter. A manufacturer supplying more drives can accumulate more failures without having a higher failure rate. A supplier whose disks have been installed longer also presents a different comparison from one whose equipment has only recently entered service. Accounting for measured differences helps separate the manufacturer association from those other characteristics.
Backblaze’s separate analysis addresses the familiar bathtub curve: the idea that hardware suffers an early period of defects, enters a relatively reliable middle age, and eventually experiences increasing wear-out failures. Backblaze says its accumulated records show dips, spikes, and plateaus that complicate that tidy pattern. Its central conclusion is that its drives are performing better and lasting longer in data-center service, an assessment also carried in a republication of the analysis by Noise.
The qualification “in data-center service” carries real weight. These are records from a particular operator’s equipment, purchasing decisions, operating environment, and retirement practices. They provide evidence about what happened to that fleet, not a countdown timer for every desktop disk or network-attached storage device.
For readers deciding whether to replace a drive, the two investigations therefore complement one another. The academic comparison says that measured manufacturer differences remain after accounting for several other variables. The fleet-history analysis says that the age profile itself has changed as Backblaze’s equipment and practices have evolved.
HGST and WD lead the study, but the Toshiba claim needs correcting
The strongest manufacturer finding is the size of the separation between HGST and Seagate. The researchers’ abstract puts HGST’s estimated failure rate at approximately 41% of Seagate’s, while Western Digital’s is approximately 52%. Toshiba sits slightly above Seagate.
Those figures describe relative failure rates under the statistical comparison. They are not the proportion of all drives that failed, and they are not a prediction that 41% of HGST disks will fail during a particular ownership period.
| Manufacturer | Finding reported in the research abstract | Practical interpretation |
|---|---|---|
| HGST | Its estimated failure rate was about 41% of Seagate’s. | It had the lowest estimated failure rate among the four manufacturer populations. |
| Western Digital | Its estimated failure rate was about 52% of Seagate’s. | It performed substantially better than Seagate, though its rate was significantly above HGST’s. |
| Seagate | It served as the comparison baseline. | Its relative position provides the reference for the other manufacturers. |
| Toshiba | Its estimated failure rate was slightly above Seagate’s. | The reported difference was much smaller than the gaps separating HGST and WD from Seagate. |
There is a material error in XDA’s explanation. After placing Toshiba above Seagate, it says Toshiba’s failure rate was “less than half” of Seagate’s. The primary abstract establishes the opposite direction: Toshiba was slightly higher. HGST and WD were the manufacturers with rates around half the Seagate baseline.
That correction matters because a reader could otherwise leave with precisely the wrong purchasing conclusion. It also illustrates why the relative numbers need an explicit reference point. “About half the failure rate” is meaningful only when the comparison population and operating context stay attached to it.
The result is substantial enough to consider in procurement, but it remains a manufacturer-level result drawn from the drives represented in Backblaze’s records. Turning it into a recommendation for a particular current retail model requires evidence about that model. An aggregate spanning multiple products and deployment periods cannot supply that missing comparison by itself.
There is also a difference between statistical adjustment and a controlled hardware experiment. Holding measured characteristics constant improves the comparison. It does not mean the researchers installed every competing drive model in identical quantities, ran an identical workload through each, and observed every unit until failure. The evidence comes from operational records, with the strengths and boundaries that entails.
Backblaze’s ten-year failure peak is encouraging, not a lifespan guarantee
Backblaze’s historical charts provide the clearest documented before-and-after comparison. In its October 15, 2025 analysis, the company put three looks at its drive population on the same chart, revealing a substantial shift in both the height and timing of the observed failure-rate peaks.
In the 2013 analysis, one peak annualized failure rate was 13.73% at approximately three years and three months of age. In the 2021 analysis, the peak was 14.24% at seven years and nine months. In the 2025 analysis, the peak was 4.25% at ten years and three months.
| Backblaze analysis | Age at the cited failure-rate peak | Peak annualized failure rate |
|---|---|---|
| 2013 | Approximately 3 years, 3 months | 13.73% |
| 2021 | Approximately 7 years, 9 months | 14.24% |
| 2025 | Approximately 10 years, 3 months | 4.25% |
These are encouraging fleet results. The latest peak occurred at an older age and was much lower than the earlier peaks. Backblaze also reported that its 2025 curve barely reached a 1.30% annualized failure rate during the first year of service.
An annualized failure rate, or AFR, expresses the observed frequency of failures on a yearly basis. Backblaze’s published calculation divides failures by observed drive-days, then multiplies by 365 and converts the result into a percentage. It is a rate derived from a population’s recorded service time.
That distinction prevents a common misreading of the ten-year figure. A peak in AFR at ten years and three months does not mean the average disk lasts ten years and three months. Nor does it mean a disk has accumulated only a 4.25% chance of failure over its entire life. The figure describes the rate at that part of the age curve, not lifetime survival.
The historical comparison also involves changing populations. Backblaze says it reported on approximately 317,230 drives at the close of the second quarter of 2025, subject to the usual exclusions used in its reports. Its earlier fleet was much smaller: approximately 35,000 drives were live by September 2014, while the 2021 analysis involved roughly 206,928.
Those fleet snapshots should not be confused with the approximately 443,000-drive research sample described by XDA. A study covering deployments over many years can include drives that were no longer present in the fleet at the final snapshot. Keeping the observation period separate from the number currently in service is essential when reading storage statistics.
The supported conclusion is that Backblaze observed a more favorable age-and-failure profile in its latest analysis. The figures give operators a reason to question rigid replacement assumptions, while leaving the decision about an individual disk dependent on more than its birthday.
Backblaze’s retirement practices change who survives into the chart
One of the most important details in Backblaze’s explanation concerns drives that never fail while under observation. The company says it now sometimes removes still-functioning drives as part of risk management and expansion of its storage capacity.
A healthy retirement changes the population available for later measurement. Once that disk leaves service, subsequent records cannot show whether it would have failed soon afterward or continued operating for years. Backblaze explicitly notes that its drive population can fall without the failure-rate spike someone might expect to accompany that decline.
This helps explain why “follow every disk until it dies” and “study a working storage fleet” are different exercises. A fleet operator has reasons to remove equipment before its final mechanical or electronic failure. The resulting data remains useful, but it represents reliability under those operational decisions.
The number of disks reaching older ages also matters. Backblaze points out that every drive has a first day, while fewer reach their fourth anniversary and fewer still survive into the oldest groups. A small number of failures can move a rate more sharply when fewer drives contribute service time to that age range.
Purchasing practices add another influence. Backblaze buys in bulk, so large groups of the same model may enter service together. If a problematic model is heavily represented, its behavior can visibly affect the fleet’s age curve. The company says its experience has shown model-by-model variation, another reason to resist treating a manufacturer’s entire catalog as one interchangeable product.
The operating environment has evolved as well. Backblaze describes an early fleet containing consumer drives, including units removed from external housings, followed by changes in purchasing flexibility, drive selection, workload, and decommissioning. Consequently, the improved curve reflects the combined results of hardware and fleet management. The records do not isolate a precise share of the improvement attributable to manufacturing alone.
There is an important sourcing boundary here: the academic study and Backblaze’s analysis both use Backblaze data. They offer different analyses, but they are not independent replications across two unrelated storage operators. Their agreement is useful context within one extensively documented operating environment.
Temperature gives HDD owners a useful operational question
Temperature is more actionable than a disk’s manufacturer or accumulated age once it is installed. The research abstract confirms that the paper examines temperature and accounts for it in the manufacturer comparison.
XDA reports an estimated 2.1% increase in failure rate for each additional degree of temperature. That is a relative increase, not an increase of 2.1 percentage points. The distinction is substantial: multiplying a rate by 1.021 produces a much smaller absolute change than adding 2.1 points to it.
For a NAS owner, that reported association makes sustained operating temperature worth attention. It does not establish a universal temperature at which every drive becomes unsafe, or a guaranteed amount of extra service life obtainable through cooling. A statistical association across an observed population should not become an invented operating limit for a particular enclosure.
Capacity deserves similar care. The primary abstract says the researchers examined its effect, while XDA reports a 3.4% lower failure rate per additional terabyte. That exact figure is not provided in the repository abstract. It is therefore a reported detail, not a sound basis on its own for paying more for a larger drive as a reliability measure.
The more defensible purchasing interpretation is that capacity belongs among the characteristics that complicate comparisons. A larger disk may also belong to a different generation or product population. Establishing an association after statistical adjustment does not turn extra terabytes into a protection mechanism that a buyer can purchase in predictable increments.
Workload is an additional boundary. XDA says the researchers could not measure workload type directly, while Backblaze describes changes in its workloads over time. The evidence therefore cannot quantify how much faster a particular desktop drive would wear out in a home NAS, or promise that selecting a NAS-branded model removes the risks identified in the fleet.
Likewise, surviving the first 90 days does not create the assurance suggested in XDA’s coverage. Neither the primary abstract nor Backblaze’s age analysis establishes a 90-day cutoff after which manufacturing or handling-related problems can be ruled out. Backblaze’s low first-year AFR describes a population; it is not a diagnostic certificate for an individual disk.
What this means for your PC or NAS replacement plan
Keep the research in your replacement planning, but do not extend a drive’s planned service life solely because a fleet chart reaches ten years. The evidence is strongest when used to improve the questions behind a decision: which drive population is comparable, what operating conditions apply, and what happens operationally when a disk must leave service?
For an individual owner, the immediate value is permission to review an age-only rule rather than blindly follow or abandon it. For an administrator, Backblaze’s account also demonstrates that replacing working drives can be a deliberate management decision. A disk can remain functional while no longer fitting the operator’s preferred balance of risk and capacity.
- Treat a drive’s fifth birthday as a review point if that fits your existing policy, rather than interpreting it as either a proven expiration date or an automatic extension to ten years.
- Use the HGST and WD findings as evidence about the studied populations, and seek model-specific evidence before treating the manufacturer ranking as a current shopping list.
- Pay attention to sustained drive temperature, while keeping the study’s relative-rate estimate separate from your hardware’s specified operating limits.
- Read Backblaze’s 4.25% peak AFR as an age-specific population rate, not the lifetime failure probability of a ten-year-old disk.
- Account for planned retirement as well as failure when comparing your equipment with Backblaze’s fleet; healthy drives removed from service no longer contribute later observations.
- Avoid using 90 days of successful operation as proof that a drive is free from defects or handling damage.
The practical advance in these records is a better basis for judgment. Backblaze has documented a fleet whose latest age profile looks considerably healthier than its earlier ones, and the academic study finds meaningful manufacturer differences after adjusting for several measured characteristics. PC and NAS owners can use that evidence to make replacement planning more specific—without replacing an oversimplified five-year deadline with an equally unsupported ten-year promise.