

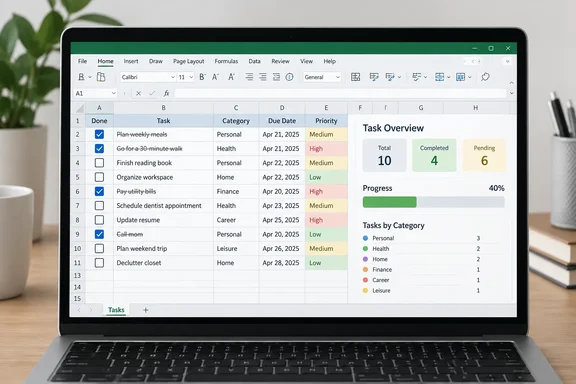
How-To Geek's Excel Task Tracker Rests on Three Microsoft 365 Features
The tracker is a small dashboard sitting on top of an ordinary list, and it depends on three documented Excel behaviors. The first is the in-cell checkbox. It stores TRUE or FALSE, and it works differently from the old floating form control. Microsoft's support documentation says a checked box has the value TRUE, an unchecked box has the value FALSE, and any formula that references the cell receives that value. Third-party tutorials say the same: a checked box stores TRUE in the cell and an unchecked box stores FALSE — so you can use the cell directly in formulas with no extra setup.
The second is the Excel table and its structured references. A structured reference combines a table name and a column name, such as T_Tasks[Status], and points at a table column instead of a fixed range like E5:E14. Microsoft's documentation says these references adjust automatically when you add or remove rows. That is why the dashboard needs no maintenance after you build it.
The third is conditional formatting. The build uses one formula-based rule for the strikethrough effect and one data bar for the progress indicator. None of these features is new. The guide's value lies in how it combines them into a single self-updating sheet.
Because the checkbox holds a real cell value, it behaves like any other data. Since the checkbox is part of the cell (not an object floating on top of it), it moves with the cell. If you move, hide, filter, or resize the cell, the checkbox goes along with it. Linked form-control checkboxes, the older approach, are fragile in exactly this situation.
Building the T_Tasks Table and In-Cell Checkboxes in Excel
The layout matters because one formula later refers to a specific cell address. How-To Geek's steps, in order:
- Open a blank worksheet and set all cells to 16pt. This is cosmetic.
- Type the headers Task Name in D4 and Status in E4. Widen column D so tasks have room.
- Enter ten placeholder tasks under Task Name, such as "Pay electricity bill" and "Renew insurance". You can replace them with real tasks later.
- Select the two columns and press Ctrl+T. Make sure the "My table has headers" box is checked.
- On the Table Design tab, uncheck Banded Rows and Filter Button for a cleaner look.
- In the Table Name box at the left of Table Design, type
T_Tasksand press Enter. - Select the Status column, go to the Insert tab and click Checkbox.
The Ctrl+T step and the rename step both match Microsoft's table documentation. Microsoft's naming rules also explain why T_Tasks is a sensible choice. Table names can't contain spaces, underscores are allowed as word separators, and Microsoft recommends a prefix that identifies the object type (it gives tbl_Sales as an example). If you rename the table or a column later, Excel updates every structured reference in the workbook that uses it, so the formulas below won't break.
Microsoft adds one caution about timing. If a table has only one data row, structured references can behave unexpectedly when more rows are added, so enter several rows before writing formulas against the table. Starting with ten sample tasks avoids that problem.
Four COUNTIFS and ROWS Formulas Turn the Checklist Into a Dashboard
Next the guide narrows columns A and C to about 20 pixels to act as margins, then builds the dashboard around the table:
| Dashboard element | Location | Formula | Formatting |
|---|---|---|---|
| Overall progress | D2:E2, merged | =COUNTIFS(T_Tasks[Status],TRUE)/ROWS(T_Tasks) | Percentage, light gray fill |
| Total tasks | Header in B4, value in B5:B6 merged | =ROWS(T_Tasks) | Light gray fill |
| Pending | Header in B8, value in B9:B10 | =COUNTIFS(T_Tasks[Status],FALSE) | Red header |
| Completed | Header in B12, value in B13:B14 | =COUNTIFS(T_Tasks[Status],TRUE) | Green header |
The logic is simple. ROWS(T_Tasks) returns the number of data rows in the table, and a table-name reference excludes the header row. COUNTIFS counts Status cells equal to TRUE or FALSE. Dividing completed by total gives a fraction between 0 and 1. Formatting it as a percentage only changes how the number is displayed. The underlying value stays between 0 and 1, which matters for the progress bar later.
The guide takes a few shortcuts to save time. It uses the Format Painter to copy the table header style onto the TOTAL TASKS label, and it builds PENDING and COMPLETED by copying and pasting the TOTAL TASKS block and editing the text, color and formula. Finally, you Ctrl-click all four merged value areas, raise them to about 26pt and center them both ways.
Once this is done you don't need to maintain the dashboard. Add a row to the table and the total rises. Tick a box and the pending and completed counts change. All of this follows from structured references tracking the table's size, as Microsoft documents.
Conditional Formatting in Excel Supplies the Strikethrough and the Progress Bar
The finishing touches take two rules.
The strikethrough rule and its row-alignment trap
Select the Task Name column, then go to Home > Conditional Formatting > New Rule > "Use a formula to determine which cells to format". Enter =$E5=TRUE, click Format, set the font to gray and turn on strikethrough. Ticking a box now crosses out the task beside it.
The formula depends on the sheet layout. The dollar sign fixes the reference to column E, where the checkboxes are, and the row number 5 stays relative. Excel reads the relative row against the first cell of the range the rule applies to. The headers sit in row 4, so the first task is in row 5, and the rule lines up only if the selected range also starts at row 5. If you include the header cell D4 when you select the column, each strikethrough will fire one row off from its checkbox. If you moved the table somewhere other than D4, change the column letter and row number to match your first data row. This is our reading of how relative references work in conditional formatting, and the guide doesn't cover it. After creating the rule, check the "Applies to" range under Conditional Formatting > Manage Rules.
The data bar as a progress meter
Select the merged progress cell, then choose Conditional Formatting > Data Bars > More Rules. Set Minimum to Number, 0, and Maximum to Number, 1. Choose a green fill and No Border. Microsoft's data bar options include the Number type for fixed minimum and maximum values. Fixed bounds are essential here. With automatic scaling, a single cell would always count as its own highest value, and the bar would stop meaning anything. Because the formula returns a decimal between 0 and 1, the bar reaches full width only when every task is checked.
To finish, turn off gridlines on the View tab. The author calls this the detail that makes the sheet feel more like an app than a spreadsheet.
Excel 2021, Excel 2024 and Excel for the Web: Where the Checkbox Workflow Runs
The whole build depends on having Insert > Checkbox, and many readers won't have it. Microsoft's support page for the feature lists only Excel for Microsoft 365 and Excel for Microsoft 365 for Mac. Owners of perpetual-license copies are left out. Trump Excel says that the new in-cell checkboxes are only available in Microsoft 365 (Windows, Mac, and Excel for the web). If you're using a perpetual license version such as Excel 2024, Excel 2021, or Excel 2019, you won't find this option. The same guide notes that a missing button can also mean your version of Excel hasn't received the update yet.
Excel for the web comes with a documentation gap. How-To Geek names it as a supported platform, but the Microsoft checkbox page doesn't list it. Several independent tutorials report that it works. One describes the Checkbox button in the browser's Insert tab in the "Cell Controls" group, and another states that the 365 Insert > Checkbox works on Mac and Excel for the web. Classic form controls require the desktop app. The weight of reporting says the web version supports the build. If you manage a tenant, test it in your own browser before promising it to users.
Keep the new feature separate from the old one. Legacy form-control checkboxes come from the Developer tab and are linked to a cell. Microsoft's form-controls page says they can't be used in Excel for the web. If you choose to edit a workbook containing them in the browser anyway, the controls are lost and have to be recovered with Previous Versions. DataCamp gives the same advice: Form Controls are not supported for editing in the web version and may be removed or become unusable when you edit the workbook in a browser. Stick to native checkboxes for files you'll access online. That warning covers the old controls only. In-cell checkboxes are plain cell values and aren't affected.
Users on Excel 2021 or 2024 can still build a version of this tracker. They could type TRUE and FALSE into the Status column, or use form controls linked to the Status cells, and the formulas would work unchanged. They lose the one-click ticking, and with form controls the workbook becomes fragile in the browser.
Hardening the Excel Tracker: Empty Tables, Merged Cells and Deleted Rows
The guide suggests testing the build instead of assuming it works: add rows, tick and untick boxes, and watch every element respond. A thorough check covers three states. With every box unchecked, the sheet should show zero completed and all tasks pending. With some checked, pending plus completed should equal the total, and the percentage should equal completed divided by total. With everything checked, you should see 100% and a full bar. If the counts don't match, check that the checkboxes are inside the Status table column and that the table and column names in the formulas match exactly.
There are three refinements the guide doesn't include.
First, an empty table breaks the percentage. The author's advice for clearing a finished task is to right-click its row and choose Delete > Table Rows, which shrinks the table and updates the dashboard. If you delete every row, though, ROWS(T_Tasks) returns zero and the progress formula divides by zero. Microsoft's conditional formatting documentation says rules aren't applied to cells that return errors and recommends IFERROR to avoid that. A safer progress formula is =IFERROR(COUNTIFS(T_Tasks[Status],TRUE)/ROWS(T_Tasks),0).
Second, deleting rows changes what the percentage means. Removing finished tasks takes them out of the total as well as the list, so the progress bar measures completion of what's left, not everything you've done. If you want a record, leave completed rows in place. The strikethrough already makes them easy to skip over.
Third, the merged cells are purely decorative. The author says merge-and-center usually gets in the way of working with or filtering data and makes an exception only because these cells are visual. If you plan to extend the dashboard, leaving the cells unmerged avoids that friction.
The tracker's scope is deliberately narrow. It has no due dates, reminders, owners, recurring tasks or categories. It's a single personal list with live counts, which fits the author's reason for building it: task software is often expensive and packed with more features than a simple list needs.
What this means for you
Start by checking your Excel version. If Insert > Checkbox is in your ribbon, you can build this tracker today. If you're on a perpetual license, you'll need a workaround or the Microsoft 365 app.
- Check for the Checkbox button on the Insert tab before you start. Microsoft documents in-cell checkboxes for Excel for Microsoft 365 on Windows and Mac, and perpetual versions such as Excel 2021 and Excel 2024 don't have them.
- Name the table
T_Tasksbefore writing any formulas, and enter several rows first, so the structured references resolve correctly and grow with the list. - Make sure the strikethrough rule's "Applies to" range starts on the same row as the
$E5reference in its formula. Otherwise the formatting lands one row off. - Wrap the progress formula in IFERROR if you might delete every task, because an empty table makes the original formula divide by zero.
- Use in-cell checkboxes, not Developer-tab form controls, for any workbook that will be edited in a browser. Microsoft warns that form controls are lost when such a file is edited in Excel for the web.
- Decide whether finished tasks get deleted or struck through. Deleting shrinks the total and resets what the percentage measures.
The build shows how far Microsoft 365's in-cell checkbox has pushed Excel. A Boolean cell, a named table and two formatting rules are enough for a working personal task app, with no macros, add-ins or subscription beyond the one you already pay. How useful it is depends on the checkbox reaching your copy of Excel, so run the version check before you spend the ten minutes.