

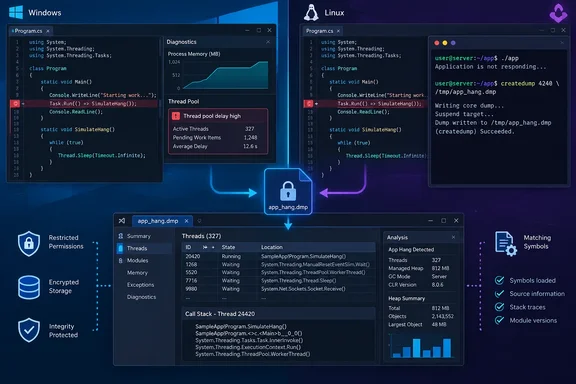
MiniDumpWriteDump; the Linux implementation launches the runtime’s createdump utility. The useful idea is to collect evidence while the problem is happening, before a developer has to reproduce it. Putting that idea into production requires deliberate choices about triggering, permissions, sensitive data, and what happens when collection fails.Aaron Powell’s example on the Microsoft.NET Blog connects three pieces that are often considered separately: detecting a responsiveness problem, writing a full process dump, and examining the result in Visual Studio. It is a diagnostic pattern with working implementation details, not a new.NET runtime feature or a complete production incident policy.
That distinction gives developers a sensible adoption path. Start by understanding what the watcher measures, validate collection under the application’s actual deployment identity, and make sure the resulting dump can answer a debugging question before enabling automatic capture.
C# dump collection starts with a delayed task, not a crash
A memory dump preserves process state at a particular moment. Microsoft’s.NET diagnostic overview describes dumps as useful when attaching a debugger is difficult, including production and continuous-integration environments. The practical benefit is that collection and investigation can happen at different times: capture the problematic process now, then inspect the saved evidence later.
Powell’s example concentrates on an application that remains alive but has become unresponsive. Its trigger is a small task submitted to the.NET thread pool, the pool of workers used to execute that work. If even this trivial task takes too long, the application records a dump for investigation.
The watcher runs on a dedicated background Thread. That choice is central to the design: the thread responsible for detecting delayed thread-pool work does not itself have to wait for a thread-pool worker before it begins the check.
The default interval is 3,000 milliseconds. Each cycle sleeps for that interval, starts a stopwatch, queues a task that stops the stopwatch, and waits up to the same interval for the task:
Thread.Sleep(interval);

Stopwatch stopwatch = Stopwatch.StartNew();
Task task = Task.Run(stopwatch.Stop);

if (!task.Wait(interval))
{
    Console.WriteLine($"Task did not complete within {interval} ms");
}

if (stopwatch.ElapsedMilliseconds <= interval)
{
    continue;
}
This code measures how long it takes for a deliberately small piece of queued work to reach execution. It does not inspect all application requests, measure every thread’s activity, or identify the reason work was delayed. A delayed probe is a reason to collect evidence, not a diagnosis of thread-pool starvation.
The three-second threshold is a collection policy
The sample uses one setting for two jobs: spacing the checks and deciding how long a task may take. Those jobs have different operational meanings. The first controls how frequently the watcher looks; the second decides when an observed delay is serious enough to justify collecting a potentially large file.
The loop also spends time waiting for each task and, when triggered, collecting the dump. Consequently, this is not a precise three-second sampling schedule. Reading it as “sleep, probe, wait, possibly collect, repeat” gives a more accurate picture of its behavior.
There is a small but relevant boundary in the implementation. The decision to collect depends on ElapsedMilliseconds being strictly greater than the interval, rather than directly on task.Wait(interval) returning false. The timeout message and the collection condition are therefore separate decisions. When adapting the example, developers should decide explicitly whether a timeout itself is the trigger or whether elapsed time is the governing measurement.
The watcher’s messages also need careful interpretation. If the task has not yet stopped the stopwatch, the displayed elapsed value is an observation made while the delay is still in progress. It is not necessarily the task’s eventual completion time.
None of this undermines the approach. It establishes what a useful validation run should demonstrate: the watcher notices a delayed probe, the delay crosses the intended policy boundary, and collection starts while the application is still in a diagnostically useful state.
The sample permits one attempt, not one successful dump
The watcher uses a static lock and counter to suppress additional captures:
lock (DumpLock)
{
    if (dumpCount++ > 0)
    {
        Console.WriteLine(
            "Dump already created for this run; skipping additional dumps.");
        continue;
    }
}
The increment happens before the operating-system-specific writer runs. Read literally, this is a one-attempt-per-run guard. A failure to create the destination file or finish the dump does not restore the allowance.
That is a meaningful production decision. Suppressing repeated attempts limits the impact of a persistent problem, but it also means the first failed collection can leave the process without a saved dump. A production adaptation should distinguish an attempted capture from a completed capture and decide how failures affect any retry or cooldown policy.
The watcher also runs in while (true). Although the class exposes Join(), the implementation has no cancellation mechanism that would make the loop exit normally. Calling Join() is not a way to stop it. Applications that need orderly shutdown should treat watcher lifecycle as integration work, not assume that naming the thread and marking it as background completes that job.
Windows MiniDumpWriteDump makes the capture explicit
On Windows, Powell’s implementation uses platform invocation, usually called P/Invoke, to call the native MiniDumpWriteDump function in dbghelp.dll. This is an established route: Microsoft’s archived “Writing minidumps in C#” guidance also describes creating Windows minidumps through that native API and using interop to reach it from C#.
The September example’s contribution is the integration around that API. It validates the target and path, creates the destination directory, opens a file, selects the dump contents, and reports a native failure back to managed code.
The imported function has this shape:
[DllImport("dbghelp.dll", SetLastError = true,
    CharSet = CharSet.Unicode)]
[return: MarshalAs(UnmanagedType.Bool)]
private static extern bool MiniDumpWriteDump(
    IntPtr hProcess,
    uint processId,
    SafeHandle hFile,
    DumpType dumpType,
    IntPtr exceptionParam,
    IntPtr userStreamParam,
    IntPtr callbackParam);
The process handle identifies the target, the process ID supplies its identifier, and the file handle identifies the destination. The DumpType flags determine which information is requested. The final three parameters can provide exception information, custom streams, and callbacks; the example passes zero for all three.
For this hang-detection scenario, the absence of exception information is unsurprising: a delayed task is not an exception. It does mean the resulting file should be approached as a captured responsiveness incident, not as a dump automatically accompanied by a faulting exception record.
Full memory and memory information serve different purposes
The sample combines seven flags. Microsoft’s MINIDUMP_TYPE documentation defines what each adds:
| Flag used by the example | Information requested |
|---|---|
WithFullMemory | All accessible memory in the process. |
WithFullMemoryInfo | Information describing memory regions. |
WithDataSegs | Data sections from loaded modules, including global variables. |
WithHandleData | High-level information about active operating-system handles. |
WithUnloadedModules | Recently unloaded module information, where the operating system maintains it. |
WithThreadInfo | Thread-state information. |
WithTokenInformation | Security-token-related information. |
Two details prevent common misunderstandings. First, WithFullMemoryInfo describes memory regions; WithFullMemory requests the accessible memory contents. Second, the name MiniDumpWriteDump does not promise a small output file. Its flags can request substantial amounts of process data.
The blog describes the selection broadly as including everything, but the API documentation is more precise: these are selected categories, and WithFullMemory covers accessible process memory. The enumeration contains additional options that this combination does not select. Calling it a full-memory capture is useful; treating it as an unconditional guarantee that every conceivable diagnostic record is present is not.
Powell reports a Windows dump of approximately 125 MB for the example. That is an attributed sample result, not a storage requirement or an estimate for an enterprise application. The documentation explicitly warns that full-memory capture can produce a very large file.
There is also a relevant failure branch. Microsoft documents that a full-memory write can fail when required memory reads fail; the separate MiniDumpIgnoreInaccessibleMemory option allows collection to continue while omitting inaccessible regions. Powell’s flag combination does not include that option. Changing it would be a decision to accept missing memory in exchange for a potentially more successful capture, not a neutral formatting change.
A valid handle and a successful write are separate checks
The helper opens its output using FileMode.Create, read/write access, and FileShare.None, then passes the stream’s SafeFileHandle to the native function. If MiniDumpWriteDump returns false, it throws a Win32Exception containing Marshal.GetLastWin32Error().
Microsoft’s API reference adds an important detail: the native last-error value for this function is an HRESULT. When collection fails, retaining the numeric value alongside the process identity and destination path is more useful than reducing the result to “dump failed.”
For another process, access rights are also part of the procedure. The API requires process-query and virtual-memory-read access; requesting handle information additionally requires duplicate-handle access. Microsoft also documents thread-access requirements. A helper method accepting any Process object does not grant the caller those rights.
The destination has its own boundary. Creating a directory establishes its existence, but this code contains no explicit access-control configuration. The resulting protection depends on the deployment environment. Similarly, exclusive sharing during the write is not a substitute for restricting who may read the finished file.
DbgHelp synchronization must cover the writer
Microsoft’s MiniDumpWriteDump reference states that DbgHelp functions are single-threaded and that concurrent calls need synchronization to avoid unexpected behavior or memory corruption.
The watcher’s DumpLock has a narrower role. It protects the counter and allows only the first watcher attempt to proceed; it is released before the dump is written. Within this particular one-shot path, later watcher attempts are suppressed. It does not serialize unrelated DbgHelp activity or direct calls to WindowsDumper.Write.
That difference matters if the helper becomes a shared service used by several parts of an application. The synchronization design then has to cover the actual relevant native calls, rather than relying on a counter in one caller.
Microsoft also recommends invoking MiniDumpWriteDump from a separate process whenever possible, particularly when the target is already unstable. Its documentation identifies loader deadlock as one possible consequence of collecting from inside the target. A dedicated thread is the documented fallback when a separate process is impractical, but it does not provide the same separation.
Powell’s dedicated watcher therefore fits a useful live-hang scenario. For severe crashes or damaged process state, an external collector deserves preference. Visual Studio’s documentation identifies Sysinternals ProcDump as an existing tool that can collect process dumps on demand or through triggers, giving teams an alternative to embedding every collection responsibility in application code.
Linux createdump adds a permission boundary to the same C# pattern
The Linux branch pursues the same diagnostic objective through a different mechanism. It finds the createdump executable beside the.NET runtime and launches it as another process.
The lookup uses:
string runtimeDirectory = RuntimeEnvironment.GetRuntimeDirectory();
string candidate = Path.Combine(runtimeDirectory, "createdump");
If the executable is missing, the helper throws FileNotFoundException. This is a concrete deployment prerequisite: before relying on automatic Linux collection, verify that the runtime layout actually contains the utility at the location the code uses.
The process-start configuration supplies three arguments:
ArgumentList =
{
    "--full",
    "-f", path,
    process.Id.ToString(),
}
Here, --full requests a full capture, -f supplies the output filename, and the final argument selects the target process. The implementation sets UseShellExecute to false and redirects standard output and standard error, then waits for the utility to exit.
A nonzero exit code becomes an exception containing the captured diagnostic output. That output is part of the collection result: it can distinguish a failed attempt from the assumption that a file must exist because the watcher reached its dump branch.
PR_SET_PTRACER_ANY is a security decision
Before dumping itself, the Linux helper calls prctl with PR_SET_PTRACER and PR_SET_PTRACER_ANY. The stated purpose is to let the child createdump process attach to its parent under Yama’s restricted tracing policy.
The implementation’s scope is broader than selecting just that child. It requests an “any tracer” allowance for the current process, and the example does not restore a narrower setting after collection. Review that permission change before adopting the Linux helper in a production service.
There is also a problem in the accompanying code comments: they describe the parent/descendant tracing relationship inconsistently with the explanation of why the child collector needs an allowance. The operational point to retain is the one embodied in the code: the target changes its tracing permission before launching a collector that needs access to it. The comments should not be used as a general description of Linux tracing policy.
This method is explicitly best-effort. It discards the integer return value from prctl, and it catches DllNotFoundException and EntryPointNotFoundException so that collection can continue when the native import cannot be resolved. Therefore, reaching the next line does not establish that the permission request succeeded.
The final result comes from createdump itself. Treating that distinction carefully avoids a misleading success message such as “ptrace enabled” when the code has neither checked the return value nor established that the relevant policy permits collection.
Container hints are not universal fixes
The sample’s failure message suggests different areas to investigate depending on whether the target is the current process or another process. For another process, it mentions root privileges, CAP_SYS_PTRACE, and Yama’s ptrace_scope. For self-collection in a container, it mentions seccomp and SELinux or AppArmor policy.
Those are areas for investigation, not interchangeable repairs. The presence of --cap-add=SYS_PTRACE in an error hint does not establish that adding that capability will satisfy every independent security restriction in a deployment.
The useful test is specific: can this application identity, in this runtime image and container configuration, launch this collector against this target and write a readable dump to this destination? A successful run in a developer’s unrestricted environment does not answer that deployment question.
The distinction between self-collection and another target is visible in the helper, too. WriteCurrentProcess makes the permission request for itself before calling Write. Calling Write with an arbitrary Process does not execute a permission change inside that target. Developers should retain that boundary when turning the class into a reusable diagnostic component.
Powell reports an approximately 800 MB Linux dump for the demonstration. The Windows and Linux numbers describe two example outputs; they are not a controlled comparison of the platforms’ memory efficiency or dump overhead. Use them as a warning that storage is consequential, then validate actual output sizes for the application being diagnosed.
Parallel.For demonstrates blocking without proving every hang is starvation
The reproduction workload is short enough to show exactly what it does:
internal static class ApplicationRunner
{
    public static void DoLotsOfWork() =>
        Parallel.For(0, 1000, DoSomeWork);

    private static void DoSomeWork(int i)
    {
        Console.WriteLine("Running task {0}", i);
        Thread.Sleep(10_000);
    }
}
The application starts the watcher before invoking that workload:
var tpw = new ThreadPoolWatcher();
tpw.Start();

ApplicationRunner.DoLotsOfWork();
Each iteration prints a message and blocks for ten seconds. The loop range requests 1,000 iterations; the code does not explicitly create 1,000 simultaneous threads. Its purpose is to keep parallel work occupied long enough that the watcher may observe delayed execution of its probe.
Although the blog introduces the problem through asynchronous code and tasks, this reproduction uses Parallel.For and synchronous sleeping. Keeping those details separate helps developers interpret the result. It demonstrates a collection trigger under deliberately blocking work, rather than reproducing every asynchronous deadlock or every kind of unresponsive web request.
The natural validation sequence is therefore modest and concrete:
- Run the workload in a controlled environment where intentional blocking and a large output file are acceptable.
- Start the watcher before starting the workload, as the example does.
- Observe whether the watcher reports a timeout or an elapsed duration over the configured threshold.
- Check whether the operating-system-specific writer completes successfully.
- Open the resulting dump and determine whether it preserves the threads and application state needed to explain the test.
An absent dump needs investigation at the right stage. The workload might not have crossed the trigger threshold, the one-attempt guard might already have been consumed, the path might be unwritable, or collection might have failed. A timeout message alone does not identify which of those stages succeeded.
The default output name helps connect an artifact to a process:
fulldump-{pid}-{yyyyMMdd-HHmmss}.dmp
The watcher puts it under AppContext.BaseDirectory and uses local time in the filename. Both are implementation choices worth recording in an incident procedure. Neither the name nor the application directory supplies retention limits, access restrictions, or evidence that the dump completed.
A successful trial should end with a usable artifact, not merely a file appearing in a directory. The next stage—loading it with appropriate debugging files—is what turns capture into a dependable diagnostic capability.
Visual Studio makes the dump useful when build artifacts match
Visual Studio treats a dump as a snapshot that can expose stacks, threads, loaded modules, and, when heap information is included, application-memory data. Microsoft’s debugger documentation compares opening a heap-containing dump to stopping at a breakpoint, with one essential difference: execution cannot continue from the saved file.
That limitation shapes the investigation. Developers can inspect the preserved state, but they cannot step forward to see what the application would have done next. The dump supplies evidence about the capture moment, while logs and telemetry retain their value for understanding the surrounding sequence.
Microsoft’s documented opening procedure is straightforward:
- In Visual Studio, select File > Open > File.
- Select the dump file, normally using the
.dmpextension. - Review the Minidump File Summary, including its module information.
- Select
Set symbol pathswhen the required symbols are not already available. - Choose
Debug with Managed Onlyfor the managed-code investigation, or an appropriate mixed or native option when the target requires it.
The summary may also offer managed-memory debugging and Run Diagnostic Analysis, depending on the applicable debugger capabilities. Those are additional analysis paths, not prerequisites for establishing that a dump opens and exposes the expected stacks.
Preserve the build that produced the incident
Microsoft specifies that full dump-debugging features require the relevant executable and DLLs, their matching PDB symbol files, and relevant source files. The executable and symbols must match the version and build present when the dump was created.
This makes release-artifact preservation part of the collection plan. A dump from yesterday’s production deployment should not be paired casually with today’s rebuilt application, even if the source looks similar.
Heap data can help Visual Studio cope with some missing binaries, but Microsoft still requires enough module information to produce valid call stacks. For dumps without heap information, the debugger relies more directly on finding the exact application binaries.
When required files are unavailable, Visual Studio presents No Binary Found, No Symbols Found, or No Source Found pages. Those messages identify a different failure from a collector that could not write a dump. Keeping the two stages separate prevents teams from changing collection permissions when the actual problem is missing build artifacts.
Optimized code also affects interpretation. Microsoft notes that inlining can produce unexpected call stacks and that optimization can change variable lifetimes. A variable that is unavailable in the debugger is not automatically evidence that the capture failed.
Windows and Linux captures retain different compatibility questions
Microsoft’s Visual Studio documentation explicitly supports debugging dump files from managed applications on Linux. That provides a route from the Linux collector back to a familiar Windows development environment.
The same documentation sets additional boundaries. Debugging a dump from a 64-bit machine requires Visual Studio on a 64-bit machine, and managed ARM dumps have a native-debugger limitation in the documented support list. “Visual Studio opens dumps” should therefore remain a scoped statement, especially for teams deploying across architectures.
Terminology needs similar care. Visual Studio does not support the older full user-mode dump format identified in its documentation, and Microsoft distinguishes that format from a dump containing heap information. Powell’s Windows use of MiniDumpWriteDump with full-memory flags should not be confused with that older format simply because both descriptions contain the word “full.”
For the blocking demonstration, the first practical question is whether the dump shows where the relevant threads were stopped. Inspect their call stacks and available state, then compare that evidence with the watcher’s timing messages. Move on to heap or broader diagnostic analysis when the incident requires it; collecting more data is useful only when the investigation can interpret it.
Put C# dump capture behind a production policy
Adopt automatic collection when a saved process snapshot can answer a recurring diagnostic question, and validate it under the same permissions and packaging used in deployment. Teams that need occasional investigation can first use an external collector; teams that need an application-specific trigger can evaluate embedding the watcher after establishing that the collection and analysis path works.
The most consequential policy is access to the result. Powell explicitly warns that full dumps may contain credentials, tokens, connection strings, and other sensitive information. The Windows selection also requests security-token-related data. These files belong in controlled incident handling, not ordinary public attachments or unrestricted support directories.
The sample recommends restricted storage and limits such as a cooldown or file-count cap. Its implementation supplies a one-attempt guard, but no complete retention policy, permission configuration, or recovery flow after collection fails. Those are clear integration boundaries rather than reasons to discard the technique.
A practical adoption checklist follows directly from the code and documentation:
- Validate the three-second trigger against the application’s intended responsiveness requirements, and record delayed probes as symptoms until dump analysis identifies a cause.
- Choose the collection boundary deliberately: an external Windows collector follows Microsoft’s preferred isolation model, while an embedded watcher provides an application-specific trigger.
- Verify the Linux runtime’s
createdumplocation and reviewPR_SET_PTRACER_ANYwith the team responsible for the deployment’s tracing and container permissions. - Use a restricted, writable destination with an explicit file-count or cooldown policy, and distinguish failed attempts from completed captures.
- Preserve matching executables, DLLs, PDB files, and relevant source so that a collected dump can support more than a cursory inspection.
- Rehearse the entire path from induced delay to readable dump, including collection errors and the application’s shutdown behavior.
Microsoft’s example makes a useful capability approachable: a C# application can notice delayed work and preserve the state needed to investigate it. The deployment decision is to make that capture bounded, permission-aware, and analyzable. Once a controlled test produces a useful dump with the right build artifacts, the same mechanism can turn a future responsiveness incident into evidence developers can act on.
References
- Creating a memory dump in C# .NET Blog · 2026-09-22T17:05:00+00:00
- Use dump files in the debugger - Visual Studio (Windows) | Microsoft Learn learn.microsoft.com
- MiniDumpWriteDump function (minidumpapiset.h) - Win32 apps | Microsoft Learn learn.microsoft.com