

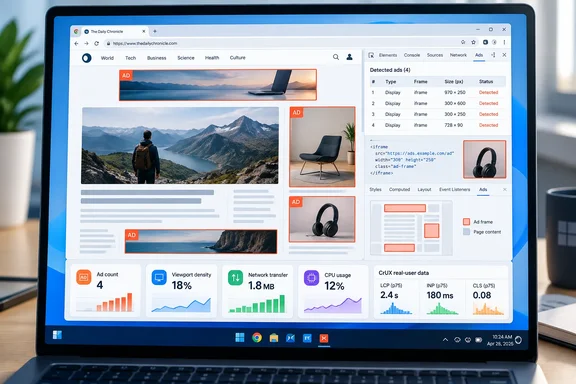
Google announced the metrics on September 15 through the Chrome for Developers blog, while MediaPost reported the launch the following day. The immediate audience is publishers, ad-tech teams, web-performance engineers, and organizations that operate customer-facing sites. For Windows users, the data comes from eligible installations of Chrome on Windows, alongside Chrome on macOS, Linux, ChromeOS, and Android. Microsoft Edge and other Chromium browsers do not feed the dataset, even though they share a browser-engine lineage with Chrome.
That distinction is consequential. A site’s reported results describe the browsing experience of a subset of Chrome users who meet CrUX’s data-collection requirements; they are not an all-browser score, a Windows-wide measurement, or a verdict on a site’s advertising practices.
Four ways Chrome will quantify ad load
The new measurements cover two different kinds of cost: what a visitor sees in the browser viewport, and what advertising consumes behind the scenes.
Ad Count is the average number of distinct ad frames visible in the viewport while a person uses a page. It is not the total number of ad slots in a document. A page that shows two advertisements for five seconds and none for the next five seconds would produce an Ad Count of 1.00 for that session.
Ad Density measures the average share of the visible page area occupied by advertisements. A sticky banner, a large in-content unit, and a video placement can therefore be reflected as a visual burden even when the page does not contain an unusually high number of individual slots.
The two Ad Weight metrics address performance. Ad Weight: Network adds the compressed wire bytes transferred for ad-related resources such as scripts, images, and stylesheets. Ad Weight: CPU adds JavaScript execution time attributed to ad frames and their subresources, reported in milliseconds.
The wording matters here: Google calls the metrics experimental, and its documentation treats them as measurements rather than performance grades. There is no “good,” “needs improvement,” or “poor” threshold comparable to Core Web Vitals. A high number can flag a trend worth investigating, but Chrome has not told publishers what number constitutes an acceptable ad load.
That leaves organizations with data but not a universal target. It also avoids a simplistic scorecard: a video-heavy news page, a slow connection, and an ad-light application can produce very different resource patterns that do not collapse neatly into one quality label.
The 75th-percentile number is not an average visitor
Google’s public descriptions have one potentially confusing inconsistency. The metrics are calculated from sessions over a rolling 28-day collection period, but the figures ultimately reported through CrUX are 75th-percentile values, not a simple average across every visit.
In practical terms, a reported Ad Density of 23 means that 75% of qualifying page sessions experienced 23% or less of the viewport occupied by ads, while the remaining 25% experienced more. The same reasoning applies to ad count, CPU use, and network weight. That is more useful than an ordinary mean for identifying a broadly poor experience, but it is not a reading of what the typical visitor sees in every circumstance.
Google samples the visible viewport once per second for Ad Count and Ad Density. An ad is considered visible for count purposes if even one pixel falls inside the viewport at the sample point. Density is more restrained: it counts only the portion actually visible, and overlapping ad areas are counted once rather than stacked repeatedly.
CPU and network measures are cumulative throughout the page visit. A resource-heavy ad that was not visible at the moment Chrome samples the page can still add to the ad-weight totals. Conversely, a hidden ad has no visual footprint for count or density, while its CPU and network activity may remain measurable.
For developers, this makes the four metrics complementary rather than interchangeable. A low density score does not prove that ads are cheap to run. A low CPU score does not prove that a page is visually comfortable to read.
ads.txt creates a public-data blind spot
The most material limitation is not prominently apparent from the short announcement: Google will only publish CrUX ad metrics for sites that declare at least one authorized seller in an ads.txt file. A page or origin without an eligible ads.txt declaration may still be inspected locally in DevTools, but it will not receive public aggregate ad metrics in CrUX.
That rule should improve confidence that Chrome’s aggregate dataset is measuring established advertising inventory, but it also means an absence of data is not evidence of an ad-free or lightweight site. A publisher can fail to appear because its ads.txt status does not meet Google’s reporting criteria, not because Chrome found no ads.
The limitation matters most for comparison dashboards. A team ranking publishers by Ad Density or Ad Weight may be looking at a filtered population: eligible, publicly discoverable sites with sufficient qualifying Chrome traffic and recognized advertising arrangements. That is useful operational data, but it is not a census of the web.
Google also says its ad detection is most reliable where advertising partners are recognizable. The company’s documentation does not present the system as an infallible classifier of every promotional element, affiliate widget, sponsorship placement, or first-party marketing component. Teams using the values in contracts, buying models, or publisher scorecards should treat them as browser telemetry with defined coverage limits, not as an audit of every commercial pixel on a page.
Chrome DevTools makes the metrics actionable on Windows
The launch is more useful for engineering teams than for media buyers alone because it includes a local diagnostic path. Chrome DevTools now includes an Ads area under the Application panel, where developers can highlight detected ad frames on a live page and inspect an individual frame’s ad status. The browser uses a red overlay to show the frames it has flagged.
That gives Windows developers a direct way to investigate a CrUX trend rather than waiting for a 28-day field-data window to settle. A site operator seeing a rise in CPU or network ad weight can use DevTools to identify likely ad frames locally, then test changes to tag loading, lazy loading, refresh behavior, creative formats, or third-party scripts.
Local measurements and public CrUX reports will not necessarily match. DevTools measures the page in the developer’s present test environment, while CrUX aggregates eligible real-user browsing over time. The ads.txt qualification is applied during CrUX aggregation rather than during the local browser inspection, creating another reason that a local result may exist even when a public metric does not.
For routine performance work, the sensible workflow is to use the local DevTools result as a debugging signal and CrUX as the validation signal. A performance improvement that only appears on a developer workstation is not proof of a better experience across Windows laptops, slower networks, or long-lived browser sessions.
Chrome is exposing data, not enforcing ad standards
Google’s announcement could sound like a new browser enforcement program, but the company has not tied the four metrics to Chrome’s existing ad-intervention rules, ranking systems, or a new penalty mechanism. The metrics are not Core Web Vitals, have no recommended thresholds, and do not change Chrome’s behavior for visitors.
The launch instead makes a category of web cost that has often been hard to isolate more visible. Chrome already reports loading, responsiveness, and visual-stability data through CrUX. Ad Count, Ad Density, CPU weight, and network weight let a site separate at least part of the advertising contribution from the rest of its page design and application code.
Google has made the initial data available through the CrUX API, CrUX History API, CrUX Vis dashboard, and the DevTools Ads panel. It says BigQuery dataset support is still in development. That omission will matter to larger organizations that rely on SQL-based reporting pipelines rather than API queries or browser dashboards.
The first practical test will arrive over the next month as coverage increases and publishers begin comparing page-level and origin-level results. For Windows developers, the immediate takeaway is simple: Chrome now offers a browser-derived way to investigate whether ads are taking screen space, CPU time, or network capacity—but the numbers need context before they become a basis for a performance target or a commercial judgment.