

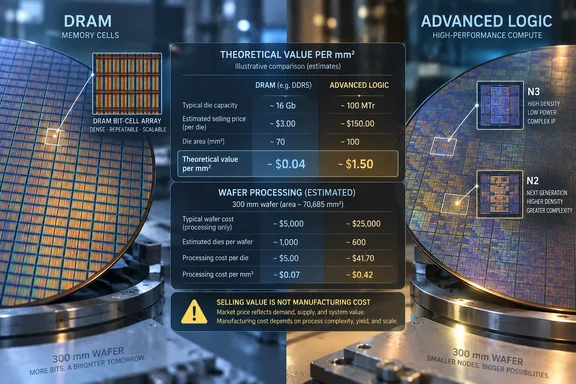
Tom’s Hardware reports that Kurnal Insights published the comparison on September 20, using an assumed DRAM price of $1.50 per gigabit and estimated prices for TSMC’s N3 and N2 manufacturing processes. The arithmetic supports the narrow observation: sufficiently dense DRAM can carry more theoretical sales value per unit of silicon area than those estimated foundry charges.
That is worth understanding before using the figures to justify an upgrade, revise a server budget, or predict the next memory-price increase. The strongest evidence concerns elevated memory prices and pressure on supply. The claim that DRAM has become more expensive to make goes beyond what the calculation measures.
DRAM’s lead over TSMC N2 depends on what “value” measures
Kurnal’s comparison, as described by Tom’s Hardware, starts with a 300-millimeter wafer—a circular slice of silicon with a nominal area of approximately 70,686 square millimeters. An assumed $20,000 price for processing that wafer using TSMC N3 works out to about $0.283 per square millimeter. Raising the assumed wafer price to $30,000 for N2 produces approximately $0.424 per square millimeter.
These are unofficial wafer-price estimates, not published TSMC tariffs. Tom’s Hardware had previously reported an estimated $18,000–$20,000 range for N3 and a rumored $30,000 figure for N2 in June 2025, while stressing that customer volumes and commercial terms affect pricing. That earlier coverage establishes the provenance of the assumptions; it does not independently confirm what a particular TSMC customer pays today.
The DRAM side uses a different calculation. Instead of dividing a wafer-processing charge by area, it multiplies memory density—the number of gigabits stored in a square millimeter—by an assumed selling price of $1.50 per gigabit. Here, “Gb” means gigabits, rather than the gigabytes commonly used to describe a PC’s installed RAM.
| Silicon category | Input used in the comparison | Calculated amount per mm² | What the amount represents |
|---|---|---|---|
| TSMC N3 | $20,000 per 300-mm wafer | $0.283 | Assumed wafer-processing price divided by nominal area. |
| TSMC N2 | $30,000 per 300-mm wafer | $0.424 | Assumed wafer-processing price divided by nominal area. |
| 1y DRAM | 0.219 Gb/mm² at $1.50/Gb | $0.329 | Theoretical selling value of the memory content. |
| 1z DRAM | 0.273 Gb/mm² at $1.50/Gb | $0.410 | Theoretical selling value of the memory content. |
| 1b DRAM | 0.436 Gb/mm² at $1.50/Gb | $0.654 | Theoretical selling value of the memory content. |
The density figures and generation labels in this table are Kurnal’s assumptions as reported by Tom’s Hardware, rather than independently verified measurements of every manufacturer’s products. Within that model, the arithmetic is straightforward: 0.436 multiplied by $1.50 equals $0.654. The 1b result is approximately 54% above the assumed N2 wafer-area figure and about 2.3 times the N3 figure.
The generation boundary matters. At the same assumed memory price, 1y DRAM exceeds the N3 reference but remains below N2, while 1z also remains below N2. A blanket statement that “DRAM is worth more per square millimeter than leading-edge logic” therefore loses a condition central to the result: the answer depends on both the memory density and the selling price selected.
Most importantly, selling value is not manufacturing cost. The calculation contains no measurement of a DRAM maker’s fabrication expenses and no measurement of TSMC’s internal cost to process a wafer. Even if every input were confirmed, the result would still compare two commercial prices at different points in the semiconductor supply chain.
DDR5 spot prices support the assumption, with a narrower scope than the headline
The $1.50-per-gigabit assumption has a recognizable market reference. According to Tom’s Hardware, DRAMeXchange’s September 21 session-average quotation for a 16Gb DDR5 eTT chip was $24.80. Dividing that by 16 gives $1.55 per gigabit; applying the assumed 1b density produces approximately $0.676 per square millimeter.
The directly available TrendForce pricing record provides a subsequent observation. Its September 22 update, timestamped 18:10 GMT+8, lists the DDR5 16Gb eTT category at a session average of $25.00, with session quotations ranging from $24.00 to $26.30. The exact September 21 figure remains attributed to Tom’s Hardware, but the September 22 record supports the narrower conclusion that a DDR5 spot-market category was trading near the price used in the comparison.
Using the September 22 average would produce $1.5625 per gigabit and, at the same assumed 1b density, approximately $0.681 per square millimeter. That is a recalculation from the published quotation, not a measured revenue figure for a memory manufacturer. It reinforces the plausibility of Kurnal’s selected price without validating the rest of the economic comparison.
The category also needs to stay attached to the number. TrendForce lists DDR5 16Gb eTT separately from its DDR5 16Gb 4800/5600 quotation and separately from finished-module prices. A quotation for one chip category cannot automatically stand in for every DDR5 chip, a desktop memory kit, or a server module.
There is a second boundary between spot and contract pricing. The spot quotation describes the market tracked in that pricing series; it does not establish the average price on the bulk of Micron, Samsung, or SK hynix shipments. Tom’s Hardware reports that TrendForce describes DDR5 spot procurement as limited and transactions as sporadic. That limits how confidently the quotation can be extrapolated into industry-wide revenue.
Contract data are not wholly absent from public view: TrendForce’s page includes selected contract-price series and summaries. What is missing for this comparison is a matched, current contract price for the relevant DRAM output, alongside confirmed foundry pricing and usable production yields. Without those inputs, the spot calculation remains a useful illustration rather than an accounting result.
AI demand explains the pricing pressure without proving a manufacturing-cost reversal
Independent reporting supports the broader connection between AI demand and memory scarcity. In its February 12 report on the DRAM shortage, IEEE Spectrum described demand and profitability for memory serving AI GPUs and other accelerators as drawing supply away from other uses and pushing prices upward. That corroborates the market mechanism behind the September comparison, though it does not independently verify Kurnal’s density figures or TSMC wafer-price assumptions.
TrendForce’s own contract-market summaries describe pressure closer to the PC buyer. Its July 2026 summary says server demand is crowding out PC DRAM supply and reports that rising end-market prices are suppressing consumer spending. Its August summary describes rising chipmaker quotations, inventory building by PC manufacturers, and component downgrades used to manage costs.
Those observations provide a more direct explanation of the reader impact than the square-millimeter comparison alone. If PC manufacturers face higher memory quotations while trying to maintain a system’s selling price, their purchasing and configuration choices come under pressure. TrendForce’s reported component downgrades show that the response can involve what goes into a machine, rather than only the price displayed beside it.
This also explains why memory can become commercially more valuable without a corresponding rise in the intrinsic difficulty of producing it. Kurnal’s model keeps density fixed and changes the value assigned to each gigabit. A higher selling price immediately raises the calculated value per square millimeter; no change in the manufacturing process is needed for that mathematical result.
The calculation is equally sensitive in the other direction. Using the unrounded $30,000 N2 wafer-area estimate and the assumed 1b density, the DRAM price needed to match N2 is approximately $0.97 per gigabit. This is a sensitivity calculation, not a forecast: it shows how the apparent ranking can change when memory prices change, even with identical production technology.
The evidence therefore supports a story about market pressure and the value of scarce output. It does not establish a permanent economic reversal between memory and compute manufacturing, nor does it support a certain date when memory prices will fall. For procurement purposes, the price and availability of the actual product remain more useful than a claim that one kind of silicon has permanently overtaken another.
Wafer area leaves out the costs that determine real chip economics
Dividing a wafer’s price by its full circular area makes the comparison easy to reproduce, but it does not produce the cost of usable logic silicon. The reported calculation makes no allowance for unusable wafer edges, the space required to separate dies, test structures, defects, or yield—the proportion of output that meets the required standard. A nominal square millimeter is not automatically a square millimeter of saleable product.
The same problem limits an extrapolation on the DRAM side. Multiplying bit density by a market quotation describes potential value in an idealized area. It does not tell us how many working chips a wafer produces, which products they become, or what fraction of shipments earns the selected spot price.
Testing and packaging introduce another difference. The comparison does not provide a matched set of costs for turning either category’s wafer output into a finished, saleable component. Those omissions prevent the figures from establishing a delivered component cost, regardless of how striking the ratio between $0.654 and $0.424 appears.
Nor would better selling-price data alone establish profitability. To compare margins, a reader would need costs as well as revenue, measured on a consistent basis. To compare revenue per wafer, the calculation would need usable output and realized selling prices. Neither question can be answered simply by treating all nominal wafer area as working product sold at a single quotation.
This is where the headline’s manufacturing claim breaks down. Tom’s Hardware frames the development as memory becoming more expensive to make, but its own explanation identifies the DRAM number as potential selling value and the TSMC number as an assumed wafer-processing charge. The supportable correction is precise: the reported DRAM valuation exceeds the estimated foundry charge under selected assumptions; production costs have not been compared.
There is still information in that result. It shows how elevated memory pricing can make a relatively small area of dense DRAM represent substantial theoretical revenue. Keeping the measurement honest preserves that insight instead of asking it to prove something it cannot.
PC and server buyers should budget against configurations, not silicon-area rankings
For a planned purchase, compare current quotations for the complete memory configuration you need; do not use the per-area calculation as a reason to accelerate or postpone spending by itself. TrendForce’s reporting supports taking memory-price pressure seriously, while the limitations of Kurnal’s model argue against translating it directly into a retail-price prediction.
For a PC buyer, the reported use of component downgrades makes configuration comparison particularly important. An unchanged system price does not answer whether the offered memory configuration has changed. For an IT buyer, the relevant evidence is likewise the price and availability attached to the specified system or module, rather than an isolated spot quotation for a chip category.
The distinction also cuts against panic buying. Elevated quotations and constrained supply establish a current purchasing problem; they do not establish that every future offer will be worse. The decision should rest on the requirement, the available configuration, and an actual quotation, with this market reporting providing context rather than a guaranteed price trajectory.
- Treat the $0.654-per-mm² DRAM figure as a theoretical selling-value calculation, not a fabrication-cost estimate.
- Keep the $20,000 N3 and $30,000 N2 wafer figures labeled as unofficial assumptions rather than confirmed TSMC customer prices.
- Distinguish DDR5 16Gb eTT spot quotations from finished-module pricing and the contract prices relevant to large purchases.
- Compare the memory configuration as well as the total price when evaluating PCs, because TrendForce reports component downgrades as one response to cost pressure.
- Base purchase timing on the requirement and current offers, rather than assuming that this comparison proves either an imminent price increase or an approaching decline.
The meaningful development is that dense DRAM, valued at a documented spot-market price, can exceed an estimated leading-edge foundry charge per nominal square millimeter. AI-related demand and pressure on PC memory supply give that observation practical relevance. Buyers should carry the resulting cost pressure into their configuration and procurement decisions—without mistaking a striking revenue-density calculation for evidence that memory has become more expensive to manufacture than compute silicon.
References
- Memory chips are now more expensive to make than compute chips on a per-area basis — AI demand drives DRAM die value past leading-edge silicon Tom's Hardware · 2026-09-22T11:12:35+00:00
- DRAM Price Trends | TrendForce trendforce.com
- TSMC could charge up to $45,000 for 1.6nm wafers — rumors allege a 50% increase in pricing over prior-gen wafers | Tom's Hardware tomshardware.com