

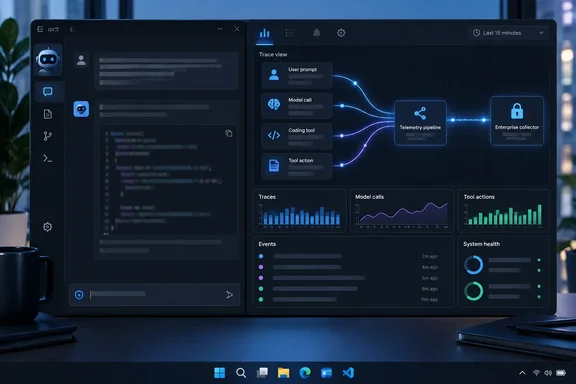
telemetry block in managed-settings.json that sends agent activity to their own monitoring backend: traces of model calls and tool use, metrics, and events. Prompt and response content stays out of that data by default. The change is small, but it finishes a pattern GitHub has been building since July. The same managed telemetry control already covered VS Code, Copilot CLI and JetBrains IDEs, and the standalone app was a gap for any organization that wanted every Copilot agent session visible in one place. One caveat for anyone planning a rollout: GitHub's settings reference had not caught up with the announcement when it was made.
The GitHub Copilot app now gets the managed OpenTelemetry export VS Code and CLI already had
GitHub's changelog entry is short. It says the Copilot app now supports OpenTelemetry (OTel) configuration through enterprise-managed settings, letting administrators export agent activity data to their organization's monitoring tools. GitHub gives three uses: following the flow of an agent session, reviewing step-by-step execution traces when an agent does something unexpected, and centrally managing telemetry settings across teams instead of per-developer configuration.
The last of those uses explains why the feature exists. In July, GitHub shipped the same control for its other clients so that organizations can now mandate where GitHub Copilot sends OpenTelemetry (OTel) data, so telemetry flows to an approved collector without each developer setting OTEL_* environment variables. That July setting covered both the Copilot Chat extension in VS Code and the agent host process that powers Copilot CLI.
JetBrains came next. On August 18, GitHub said Copilot for JetBrains now supported managed settings that let administrators can centrally configure OpenTelemetry for Copilot in JetBrains IDEs, including the collector endpoint, protocol, service name, resource attributes, and content-capture policy. The desktop app is the fourth client to get the same governance hook, so an organization can now route agent telemetry from all four surfaces to one collector with one policy.
The announcement doesn't give a minimum app version, rollout cohort or licensing tier beyond enterprise-managed settings. Managed settings are an enterprise feature, so this does nothing for individual Copilot Pro subscribers running the app on a personal machine.
What Copilot's OpenTelemetry traces, metrics and events actually record
OpenTelemetry is a vendor-neutral standard for application telemetry. GitHub's concept documentation says it provides a standard way to collect telemetry events and metrics and export them to compatible observability tools. Turning it on for Copilot means you can send data from users' Copilot clients to an OTel-compatible backend.
GitHub splits the exported data into three signal types:
- Traces tie together the steps of an agent session. GitHub's example is a trace can show an agent calling a model, using the readFile tool, and calling the model again to produce a response.
- Metrics are numeric measurements that help you identify patterns over time. GitHub's documentation uses input and output token counts for model calls as the example.
- Events record single actions. GitHub's example is an edit-feedback event that shows whether a developer accepted or rejected an edit the agent proposed.
For a team debugging agent behavior, traces are the most useful part. When an agent reads the wrong file, loops on a tool call, or burns tokens on a simple request, a trace shows the sequence of model calls and tool invocations that led there. It shows what happened. Working out why the model chose that path is still analysis a person has to do. GitHub's announcement includes an illustration of a trace in Splunk Observability Cloud's Trace Analyzer. Splunk is an example there, not a requirement: any backend that accepts OTLP (the OpenTelemetry Protocol) will do.
"Content excluded by default" doesn't mean "no data about users." Traces, metrics and events are still exported. What's left out by default is the content itself. GitHub's documentation lists prompts, responses and tool arguments as excluded, and warns that captured content can include sensitive material such as code, file contents and user prompts.
The managed-settings.json telemetry block, field by field
According to the changelog, admins turn on export by setting the telemetry property in managed-settings.json and giving an endpoint to receive the data. GitHub's enterprise settings reference describes the property as one that configures OpenTelemetry export, routing Copilot usage data to a collector of your choice, and gives this example block:
"telemetry": {
  "enabled": true,
  "endpoint": "[url]https://otel-collector.example.com[/url]",
  "protocol": "http/protobuf",
  "captureContent": false,
  "lockCaptureContent": true,
  "serviceName": "copilot",
  "resourceAttributes": {
    "deployment.environment": "production"
  },
  "headers": {
    "Authorization": "Bearer TOKEN"
  }
}
The fields break down like this:
| Field | Purpose |
|---|---|
enabled | Turns export on (true) or off (false) |
endpoint | URL of the OTLP collector |
protocol | Transport used for export |
captureContent | Whether prompt and response content is included |
lockCaptureContent | Stops users from changing the content-capture setting |
serviceName | Service name label on the telemetry |
resourceAttributes | OTel resource attributes attached to all exported data |
headers | HTTP headers, such as a collector authentication token |
Two of these fields need a deliberate decision. Setting captureContent to true puts source code and prompts into your observability store, and everyone with access to that store can then read them. lockCaptureContent turns the content policy into a hard rule instead of a default a developer can flip. The July changelog describes both halves: whether prompt, response, and tool content is captured, and whether developers can change that.
The headers field usually holds a credential. For VS Code and CLI, GitHub built in a safeguard: managed exporter headers are applied only to the Copilot Chat extension's OTLP exporter and are never passed through environment variables, so a value such as an authentication token can't leak into the tool subprocesses that the agent host spawns. GitHub hasn't said whether the desktop app handles headers the same way. If you're putting a live token in that block, treat that as an open question.
GitHub's settings reference still scopes Copilot telemetry to CLI and VS Code
This is where the announcement and the documentation disagree. The changelog says the app supports the telemetry property. GitHub's enterprise managed settings reference, the page that defines the schema, still says this property is supported for Copilot CLI and VS Code. It doesn't mention the app, and it doesn't mention JetBrains either, even though JetBrains support was announced in August. So the reference seems to trail the product by more than one release. For now, the changelog is the best evidence of what the app supports. That means the field-level details above are documented for CLI and VS Code and assumed for the app.
The protocol values don't match either. The reference lists http/json and http/protobuf as accepted values. The July VS Code and CLI changelog described the OTLP export endpoint and transport protocol (otlp-http or otlp-grpc). Those aren't the same set: one includes gRPC, the other only HTTP encodings. If your collector only accepts OTLP over gRPC, test with a real app client before assuming the app will connect.
This kind of drift has been noticed outside GitHub's documentation too. A public demo repository of enterprise-managed settings for the Copilot app includes a validator that asks the Copilot runtime what it enforced, so you never have to take a documentation table on faith. Its author reports that running it against the published docs turned up several discrepancies. That is one developer's testing, not a GitHub statement. The approach is still sound: after deploying a policy, check what the client actually applied instead of relying on what the docs say it should apply.
Deploying Copilot app telemetry on Windows through MDM, server-managed or file-based settings
The changelog names managed-settings.json and nothing more about delivery. GitHub's broader managed-settings documentation describes three channels. The July changelog summarized them as native MDM (Windows Registry or macOS managed preferences), server-managed settings resolved from the signed-in GitHub account, or a file-based managed-settings.json. GitHub hasn't said which of these the app's telemetry setting supports. The demo repository mentioned above ships install scripts for all three delivery channels for the app, which suggests all three work, but GitHub hasn't confirmed it.
GitHub's deployment guide describes each channel this way:
- Server-managed settings are stored in the enterprise's
.github-privaterepository atcopilot/managed-settings.json. After a commit to the default branch, supported clients pick up the change automatically in about an hour. Restarting the client or signing in again forces an immediate refresh. - File-based settings go in a fixed path on each machine:
%ProgramFiles%\GitHubCopilot\managed-settings.jsonon Windows,/Library/Application Support/GitHubCopilot/managed-settings.jsonon macOS, and/etc/github-copilot/managed-settings.jsonon Linux. - MDM delivery works on Windows and macOS. It isn't available on Linux.
When more than one channel supplies settings, GitHub documents this order of precedence: MDM first, then server-managed, then file-based, then the user's own settings. A few composed security keys are exceptions and resolve in the most restrictive direction. For telemetry, that means a stale file left in %ProgramFiles% from a pilot will lose to an MDM-delivered policy. Deleting the file won't turn export off if a higher-precedence channel still sets it.
The demo repository's workflow for the app is short: install a policy, restart the app, and ask the runtime what happened. The restart step fits GitHub's own note that restarting forces a refresh. On the backend side, GitHub's OTel guidance says to set up a secure OTLP-capable backend first. Some accept OTLP directly. For those that don't, an OpenTelemetry Collector can receive, process and forward the data.
What this means for you
If your organization already sends VS Code or Copilot CLI agent telemetry to a collector, extend the same telemetry block to the Copilot app now, then check that app sessions actually show up. If you have no OTel pipeline yet, don't rush. The prerequisite is a secure OTLP backend with sensible access controls, and building that is the larger job. Copilot users outside an enterprise can ignore this change, because managed settings don't apply to them.
- Leave
captureContentset tofalseand setlockCaptureContenttotrueunless you've decided, with your security and privacy teams, to store prompts and code in your observability platform. - Assume the app follows the documented CLI and VS Code schema only until you've confirmed it with a live client. GitHub's reference still lists telemetry as CLI and VS Code only.
- If your collector only speaks gRPC, test the
protocolvalue before rollout. GitHub's July changelog and its settings reference list different transport options. - Treat the
headersblock as a secret. Scope the collector token narrowly, and remember that GitHub has only documented header isolation for VS Code and CLI. - Before changing the telemetry policy, check which delivery channel wins on each machine. MDM overrides server-managed settings, which override the file under
%ProgramFiles%\GitHubCopilot. - After any policy change, restart the app or have the user sign in again. Otherwise server-managed updates can take about an hour to arrive.
With the desktop app added, one managed policy can now send agent traces from VS Code, Copilot CLI, JetBrains and the app to the same collector. For organizations that need to answer what their coding agents did, including which files they read, which tools they called and how many tokens they used, that covers every Copilot client GitHub ships. GitHub's settings reference will be the formal confirmation once it lists the app next to CLI and VS Code. Until then, test the policy against a live app client before rolling it out widely.
References
- OpenTelemetry in the GitHub Copilot app GitHub Changelog · 2026-09-23T02:14:54+00:00
- OpenTelemetry for agent monitoring - GitHub Docs docs.github.com
- Enterprise managed settings - GitHub Docs docs.github.com