

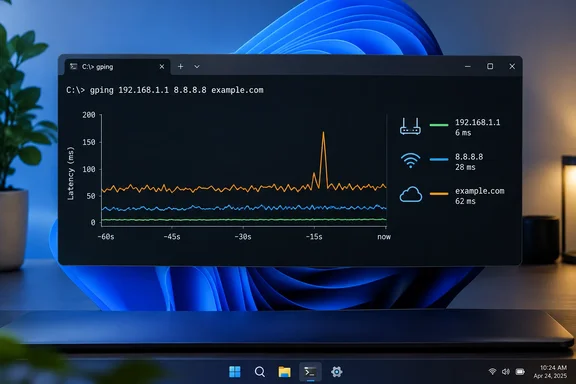
ping. It makes ping far easier to read.
What gping actually is
The project describes itself as "Ping, but with a graph." It graphs ping times for several hosts, graphs command execution time with --cmd, supports custom colours, and runs on Windows, Mac and Linux. Lewis's piece describes it as a single binary. It needs no daemon, account or web dashboard, and it draws a coloured line chart in the terminal. FreeBSD is covered too.
By default you get a 30-second rolling window and a 0.2-second ping interval. The project's help text says the watch interval accepts partial seconds, and that the default is 0.2 for ping and 0.5 for --cmd. Lewis says summary figures per host are shown beside the graph, so the numbers are still there if you want them.
The project is open source under the MIT licence. GitHub's release page lists gping v1.21.0 as the latest release, published 31 August. That release includes a gping-Windows-msvc-x86_64.zip asset of about 1.11 MB.
Installing it on Windows
The README documents several routes:
- Chocolatey:
choco install gping - WinGet:
winget.exe install orf.gping - Scoop:
scoop install gping - Download the latest release from the GitHub releases page.
Once it is installed, open Windows Terminal, PowerShell or Command Prompt and run gping followed by a host. Lewis says q or Escape quits. I could not confirm that in the official help text, so treat it as his report.
If you work in a managed environment, run any new command-line tool through your normal software-approval process first. The project page lists distribution routes. It does not assess whether they are acceptable for your organisation.
Flags worth knowing
The official help text and man page confirm the options Lewis highlights:
| Flag | What it does |
|---|---|
-b 60 | Shows 60 seconds of history instead of the default 30 |
-n 1 | Pings once per second instead of five times per second |
-4 / -6 | Resolves targets to IPv4 or IPv6 |
-i <interface> | Selects the interface to ping from |
-c / --color | Assigns colours to graph entries, in the order the targets are listed |
--cmd | Graphs how long a command takes to run instead of pinging |
-s | Uses dots instead of braille characters |
--clear | Clears the graph from the terminal on exit |
Colours accept named values or #RRGGBB hex codes. The -i flag is handy on a laptop with both Wi-Fi and Ethernet, because you can test one against the other.
The man page also documents options Lewis does not mention:
--yminand--ymaxfix the vertical axis.--tcpswitches to TCP pings instead of ICMP.--tcp-portdefaults to 80.--tcp-rstdecides how a refused connection is treated. By default it counts as a successful response, because the host answered even though nothing is listening.dropcounts it as a failure.--ping-argspasses extra, platform-dependent arguments through to the systemping.
The multi-target trick
Lewis's strongest suggestion is to ping several targets at once, for example your router, a DNS server and a website, so all three traces share one chart. The idea is to see whether a glitch hits everything at once or only one path.
- All lines wobble together: investigate the local link or something shared by all the paths, such as Wi-Fi, the router or the ISP connection.
- The router line is steady but a remote line misbehaves: look beyond your gateway.
Treat this as a heuristic. A graph shows measured replies from the targets you picked. It does not show every hop on the route.
Where to be careful
Lewis suggests that a sawtooth pattern might point to bandwidth saturation or a Wi-Fi adapter in power-saving mode. That is plausible, but gping's documentation does not back any pattern-to-cause claims. Treat spikes, gaps and sawtooth shapes as prompts for follow-up tests, not diagnoses.
Three more caveats apply:
- Ping is not call quality. Microsoft's documentation says
pingverifies IP-level connectivity by sending ICMP echo requests and reporting replies and round-trip times. A clean graph does not prove that Teams, a game server or a web app is working well. Some hosts also deprioritise or block ICMP, so a missing reply is not proof of an outage. - Pinging a DNS server does not test name resolution. It only shows that the server answers echo requests. Microsoft's guidance is to compare pinging a hostname with pinging its IP address when you suspect a name-resolution problem.
- A 30-second buffer is a display window, not a log. There is no documented alerting or history. Lewis points to Uptime Kuma or SmokePing for long-term tracking. A separate write-up on Zendot makes the same point, saying that for history and alerting you still need something like Prometheus.
Don't alias ping to gping
Lewis used gping as a full-time ping replacement for a few weeks. He still advises against aliasing ping to it. gping does not accept every argument that native ping does, and he says that broke commands and scripts he found online. On Windows the native syntax uses slash switches such as /t and /n. Windows ping is also what many scripts and support walkthroughs expect.
The safer approach is to call gping explicitly and leave ping alone.
A practical starting recipe
- Find your default gateway address, for example with
ipconfig. - Run
gping <gateway> <a public IP you trust> <a hostname>. - Add
-b 60if the problem is intermittent, and-cto separate similar-looking lines. - If you have both Wi-Fi and Ethernet, repeat the test with
-ifor each interface and compare. - Whatever you find, confirm it with other tools before changing hardware or calling your ISP.
Bottom line
gping is a small, free, open-source tool that does one job: it makes latency visible. Its value is in spotting short-lived jitter and comparing a few targets at a glance, not in diagnosing causes or monitoring over time. Install it next to ping, not instead of it.
References
- This free networking tool turns ping into a graph I can actually understand How-To Geek · 2026-10-04T17:35:16+00:00
- GitHub - orf/gping: Ping, but with a graph · GitHub github.com
- Releases: orf/gping github.com