

The WNBF report on the study, aimed at New York job seekers, gets the core figures right. The more useful points are further down in Oxylabs' data: how much Microsoft tools show up once you break postings down by role, where Azure beats AWS, and what a count of job postings can and can't tell someone planning their next certification.
New York Is Third in Oxylabs' 850,000-Posting Study, but the Skills Data Is National
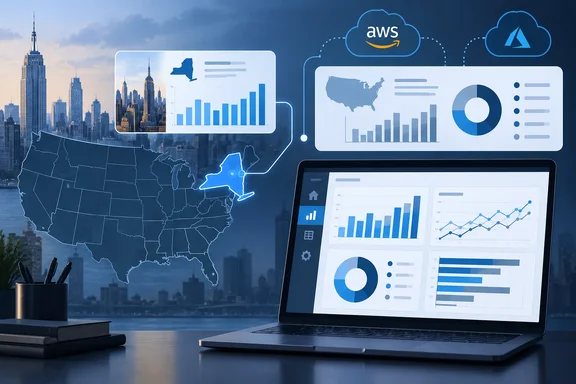
The state figures are simple. California leads in technology hiring, representing 13% of the 850,000 tech job postings analyzed by Oxylabs between January 2025 and March 2026. Texas follows with 8%, New York with 5%, and Virginia with 4%. All other states accounted for 3% or less of postings referencing at least one technology tool.
Oxylabs says the ranking mostly follows population: bigger states post more jobs. The state that stands out per person is Virginia, not New York. Virginia posted nearly three times as many tech jobs per capita as the national average, which Oxylabs attributed to the state's concentration of data centers supporting major cloud providers. So New York is a large market in absolute terms, but the report doesn't call it an unusually concentrated one.
The 5% share also needs care. It's a share of postings in one dataset. It isn't a share of actual hires, open positions, or tech employment. A single posting can stand for several openings or none that get filled. The figure shows that New York is a big source of tech listings. It doesn't measure how many New Yorkers got hired.
Every outlet that covered the study, including trade sites, regional news, and press-release aggregators, uses the same Oxylabs figures. They all trace back to the one Oxylabs release, and no independent data backs up the numbers.
Azure Is in 24% of Postings, Second Only to AWS
Oxylabs' top 10 list is mostly cloud and infrastructure tools. The tool that comes closest to unlocking the entire tech job market is Amazon Web Services (AWS), appearing in 30% of all postings. It is followed by Microsoft Azure (24%), Git (21%), Excel (15%), Google Cloud Platform or GCP (14%), Kubernetes (14%), Docker (13%), Power BI (9%), Terraform (8%), and Tableau (7.5%). Oxylabs' own report puts Tableau at 7.5%, while the syndicated press release rounds it to 7%. It's the same number rounded differently.
Three of the ten are Microsoft products: Azure, Excel and Power BI. Git is the version control tool behind GitHub, so a fourth entry sits right next to Microsoft's developer business. Within the cloud category itself, AWS leads by a clear margin, mentioned 1.2 times more often than Azure and 2.1 times more than GCP.
The overlap figure matters more for Azure specialists than the ranking does. Nearly 42% of all analyzed postings required knowledge of at least one major cloud platform. AWS and Azure also emerged as the most co-mentioned duo, appearing together in 15% of job descriptions. Our inference: many employers seem to run both clouds or hire for both, so skills in only one platform will leave some listings out of reach.
Region matters too. While AWS led hiring requirements across most states, Microsoft Azure was the most requested platform in several Upper Midwest and Southern states, including Minnesota, Indiana and Tennessee. The full list in Oxylabs' report is Minnesota, Wisconsin, North Dakota, Michigan, Nebraska, Oklahoma, Arkansas, Louisiana, Tennessee, Kentucky and Indiana. Oxylabs links this to regional enterprise ties to Microsoft in manufacturing, agriculture and healthcare. The report says AWS leads everywhere else. New York isn't on the Azure list, so by the report's own framing AWS is the top cloud in New York postings. That's the closest the data gets to a New York-specific skills finding, and it comes from reading the state breakdown, not from a separate New York table.
Power BI Beats Tableau, and Excel Still Shows Up Everywhere
In business intelligence (BI), Microsoft's tool comes out ahead. Power BI has pulled ahead of Tableau – mentioned 1.2 times more frequently – likely driven by its deep integration into the Microsoft 365 ecosystem. The Microsoft 365 explanation is Oxylabs' guess. The data shows how often each tool appears, not why employers choose it.
The gap gets bigger in the roles where BI tools are the main job. In postings Oxylabs classed as Data Analysts and BI Specialists, Power BI appeared in 43% and Excel in 41%, with Tableau at 36%. For Windows-based analysts and Microsoft 365 admins who have picked up Power BI through reporting work, this is the category where that skill is most clearly in demand.
Excel ranks fourth overall at 15%. Oxylabs treats it as a baseline expectation more than a differentiator. It says Excel appears in 46% of Data Entry and IT Support listings and is mentioned 38 times more often than Google Sheets. The Excel figure comes with a counting problem. "Excel" is also a common English word, as in "excel at communication." Oxylabs says it used a large language model to check whether each ambiguous match meant the software, and admits some misclassifications probably got through.
As a category, BI and analytics tools including Power BI, Tableau and Looker made up 18% of all tool mentions. WNBF says "cloud platforms alone made up 47% of all tool mentions," which is close but not quite right. Data Storage and Infrastructure utilities—chiefly cloud ecosystems like AWS, Azure, and GCP—comprised 47% of all recorded software mentions. That category includes more than cloud platforms. These category figures are also shares of tool mentions, not of postings, so they can't be compared directly with Azure's 24%.
Which Tools Matter Depends on the Role You Want
The national top 10 is an average across very different jobs, and it hides what each job actually asks for. Oxylabs makes this point itself. Its Tech Lead Andrius Kūkšta says "Chasing the most 'advanced' or talked-about tools without building cloud fundamentals first is a risky strategy." His recommendation is to pick a target role first and then learn the tools for that path.
The role breakdowns show why. Azure's national rate is 24%, but it is much higher in operations and security work:
| Role category (national) | AWS | Azure | Other leading tools |
|---|---|---|---|
| DevOps and Site Reliability Engineers | 58% | 45% | Kubernetes 39%, Terraform 38% |
| Data Engineers and Architects | 47% | 42% | Spark 30%, Snowflake 26%, GCP 24% |
| Cybersecurity | 39% | 35% | GCP 20% |
| Data Scientists and AI/ML | 37% | 30% | GCP 25%, Git 19% |
| Tech and Engineering Managers | 33% | 22% | GCP 18% |
| Data Analysts and BI Specialists | — | — | Power BI 43%, Excel 41%, Tableau 36% |
For sysadmins deciding what to learn next, the DevOps and cybersecurity rows stand out. Azure appears in more than a third of security postings and nearly half of DevOps and SRE (site reliability engineering) postings. Terraform, an infrastructure-as-code tool, appears alongside it in 38% of DevOps and SRE listings. Software engineering looks different: Oxylabs found AWS in 32% of software engineer postings and Git in 31%.
The mix of roles affects where the demand is. Software engineering roles represented the largest share of posting volume at 38%, followed by Data Science and AI/ML at 14%, Tech and Engineering Management at 14%, and DevOps and Cloud roles at 12%. Data Analysis and BI made up 11%. Oxylabs says these top five categories account for nearly 90% of the postings.
By industry, the core tech sector dominates. Beyond the technology sector, which accounted for 45% of all postings, professional services generated 17% of hiring demand, followed by finance and manufacturing at 8% each.
How Oxylabs Counted, and the Limits of Posting Data
Oxylabs sells web-scraping and proxy services, and this report doubles as marketing for its data work. The method is still documented well enough to judge. The postings come from Coresignal's multi-source jobs database, which collects listings from across the open web. Tools were found mostly by keyword search in job descriptions. Job titles were sorted into 18 standard categories, and 12 tech-focused categories make up the core analysis.
Several method details change how the numbers should be read:
- Each posting counts once, whatever the salary, seniority, or number of openings it covers, so a senior Azure architect role and a junior help desk listing count the same.
- The date in the dataset is when Coresignal added the posting, not always when the employer published it, and Oxylabs says this could shift timing by about a month.
- Duplicates were removed when the same company posted the same role on several boards around the same time, but recruiter postings stayed in, and some employers and job boards may be overrepresented.
- The figures show how often a tool is mentioned in postings, not how many people have the skill, how many hires happened, or whether one tool is better than another.
- A role can fit more than one category, so the role percentages don't have to add up to 100%.
Timing matters as well. The first quarter of 2026 alone accounted for 39% of all job postings in the dataset—3.7 times more activity than during the same period a year earlier. So the rankings lean heavily toward early-2026 demand. Oxylabs' report, last updated August 11, 2026, says that surge has probably cooled since. The data ends in March 2026, so it describes a hiring window that is already six months old.
What This Means for Windows Admins and New York Job Seekers
If you're deciding what to learn, start with the role you're aiming for, not the national top 10. For anyone coming from Windows administration, Microsoft 365 or Entra, the data points to cloud platforms and infrastructure-as-code for operations and security roles, and Power BI plus Excel for analyst roles. It doesn't support dropping AWS: AWS leads nationally and, by the report's state breakdown, in New York too, and AWS and Azure appear together in 15% of postings.
People in New York get one real local fact from the study, which is that the state is a big source of tech listings. The skill priorities are national figures, and nothing in the study says certifications, community college courses or skipping a degree will improve your odds. WNBF suggests those routes, but the Oxylabs data doesn't test them.
- New York made up about 5% of the roughly 850,000 postings Oxylabs analyzed, third behind California (13%) and Texas (8%). That's a share of postings, not of hires.
- Microsoft Azure appeared in 24% of postings nationwide, 45% of DevOps and SRE postings, and 35% of cybersecurity postings.
- Power BI (9%) was mentioned 1.2 times as often as Tableau (7.5%) overall, and it leads Data Analyst and BI listings at 43%.
- Azure is the most requested cloud only in a cluster of Upper Midwest and Southern states. New York isn't in that group, so AWS leads there.
- The 47% figure is the share of tool mentions for the Data Storage and Infrastructure category. It isn't the share of postings requiring a cloud platform, which Oxylabs puts at nearly 42%.
- The data covers January 2025 to March 2026 and is weighted toward early 2026, so compare it with current listings in your target role before committing to a study plan.
For Microsoft-focused IT professionals, Oxylabs' data shows steady demand for the tools many already use at work: Azure for infrastructure and security, Power BI and Excel for reporting. Most listings also expect some AWS alongside them. The main correction for New York readers is that the report shows how many tech jobs New York posts, not which skills New York employers want. The most useful next check is a look at current listings for your target role, since this dataset stops in March 2026 and its busiest quarter has probably passed.
References
- Here's What New York Tech Employers Are Hiring For Right Now WNBF · 2026-09-25T11:17:33.877000+00:00
- Job Markets Shift, But Employer Priorities Don't: What 850,000 Tech Postings Reveal About the Skills That Always Matter oxylabs.io