

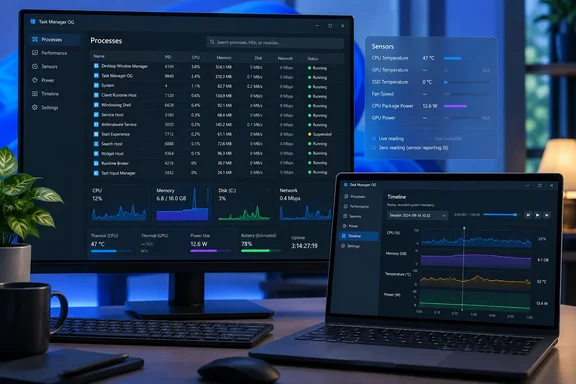
Plummer wrote the original Windows Task Manager, giving this project an unusually direct connection to the utility it reimagines. But TMOG is a separate application, not a Microsoft update or an impending change to Windows 11. Its usefulness therefore rests on what it adds to the troubleshooting process, rather than on its creator’s résumé.
The official TMOG site and release notes describe a substantial proposition: three native applications built around a shared measuring core, explicit handling of unavailable sensor data, and a Pro Flight Recorder that saves and replays telemetry. They also establish the limits that matter before installation: incomplete hardware-sensor coverage, differences between platforms, and a Windows-specific temperature fix that puts Windows on a different version from macOS and Linux.
Task Manager OG brings Plummer’s project to Windows 11 and Arm64
TMOG has moved beyond the earlier public version that left Windows users waiting. Windows Central’s August 13 coverage described a working incarnation of Plummer’s project following an earlier concept demonstration. The current official download page now lists Windows 11 x64 and Arm64 packages, alongside macOS and Linux builds. Those are different availability snapshots; an August account of the project should not be used to conclude that the September release remains Mac-only.
For Windows readers, the architecture distinction is practical. TMOG offers separate x64 and Arm downloads, each in installer and ZIP form. Windows 11 is the documented target; the published requirements do not establish Windows 10 or Windows Server support. Nor does the presence of a ZIP download, by itself, establish every behavior someone might expect from a fully portable application.
The other platforms have their own explicit boundaries:
| Platform | Documented target | Available package choices |
|---|---|---|
| Windows | Windows 11 on x64 or Arm64 | Architecture-specific installer and ZIP downloads. |
| macOS | macOS 14 or later on Apple silicon or Intel x64 | A macOS download described as signed and notarized. |
| Linux | Desktop Linux on x64 or Arm64 | AppImage, Debian/Ubuntu .deb, and .tar.gz packages. |
The official release notes identify the main release as Beta3.1, version 0.1.4. Windows has a subsequent Beta3.1.1 hotfix, version 0.1.5, while macOS and Linux remain on 0.1.4. Anyone comparing versions across machines should therefore expect this documented difference rather than assume every platform must display the same number.
That Windows hotfix addresses a specific measurement problem. Beta3.1 left the Summary and Thermals temperature blank on machines whose only CPU-adjacent sensor was a firmware thermal zone; Beta3.1.1 restores that reading. It is a narrowly described correction, not a claim that every Windows computer now exposes every temperature sensor. The release notes continue to acknowledge incomplete hardware-dependent coverage.
This makes TMOG suitable for evaluation as an additional diagnostic tool. It does not establish the application as a universal substitute for Windows’ built-in administrative utilities, and its desktop platform list should not be mistaken for a statement of enterprise fleet-management support.
TMOG’s missing readings may be as important as its visible ones
A system monitor earns trust through the meaning of its numbers. TMOG’s official documentation makes an unusually useful promise here: a measured zero and an unavailable reading are different states. If a sensor or measurement provider cannot supply a value, the application says it will not quietly turn that absence into a plausible-looking zero.
The same rule applies to history. TMOG says it leaves a gap when measurements stop, rather than drawing a continuous line through the missing interval. The practical implication is straightforward: a blank segment cannot be read as evidence that the machine was idle, cool, or consuming no power. It means the application lacks the measurement needed to describe that interval.
These are developer-documented design claims, not results of independent WindowsForum testing. Nevertheless, they give readers a concrete standard against which to evaluate the application. A graph that admits its gaps can support a more careful diagnosis than one whose visual continuity conceals uncertainty.
Process identity receives similar attention. A process ID, or PID, is the number used to identify a running process; TMOG’s documentation explicitly accounts for the operating system reusing that number. Plummer says the application pairs the PID with its creation identity so that reuse cannot redirect an action toward the wrong process. That is a correctness safeguard around identifying the intended target, rather than a reason to treat every process action as safe.
The live interface also supports sorting and filtering a process hierarchy and comparing CPU, memory, disk, network, and energy impact. Its CPU display distinguishes performance and efficiency cores and can switch among overall, logical-processor, and NUMA views. NUMA is a way of presenting systems whose processor and memory resources have a locality structure; it will not be the useful view for every desktop. The broader point is that TMOG offers different levels of detail instead of requiring every workload to be interpreted through a single aggregate CPU percentage.
Those capabilities can help connect a visible symptom to a resource change, but the distinction between correlation and diagnosis still matters. A process appearing near the top of a resource list during a slowdown is evidence to investigate. The vendor’s “one glance” marketing should not be interpreted as proof that every bottleneck, stalled transfer, or power problem will have an immediately identifiable cause.
Flight Recorder gives TMOG Pro a concrete troubleshooting purpose
For many readers, the most consequential paid feature will be Flight Recorder. The official site identifies it as a Pro capability that records, saves, scrubs, and replays seven telemetry panels on Windows, macOS, and Linux. It uses a shared .tmogtrace format, giving the recorded information an interchangeable representation across the three applications.
The practical attraction is the ability to inspect a captured interval after the event. A live display answers what the application is measuring now; recorded telemetry lets the user return to a period when the machine behaved badly. That is particularly relevant to intermittent symptoms, where watching a dashboard and experiencing the problem do not reliably happen at the same time.
Recording is the essential boundary. The documented ability to replay a trace should not be read as a promise to recover a slowdown that happened before relevant data was captured. The published description also does not establish an always-on retention period or automatic incident-triggered recording. Readers buying specifically for unattended capture should distinguish the verified record-and-replay capability from those additional workflow expectations.
The Pro price is $39.95 in both Thurrott’s September report and the official checkout listing. The checkout evidence establishes that amount, but it does not establish device counts, subscription terms, or lifetime-upgrade rights. Those purchase conditions materially affect the value for someone supporting several computers, so the price alone is not enough to calculate a per-machine or long-term cost.
Feature packaging requires similar care. Thurrott reports that the free application includes familiar areas such as Performance, Processes, App history, Startup apps, Users, and Services, with Summary and System info views added. It identifies Power & freq, Flight Recorder, Connections, Installed Apps, Drivers, Disk Space, and Benchmarks as additional Pro views. The official landing page’s twelve-destination list is not identical: it does not list App history, Drivers, or Flight Recorder among those destinations, although it separately and explicitly confirms Flight Recorder as Pro.
These descriptions should not be combined into an invented, definitive edition matrix. The secure buying conclusion is narrower: there is a free edition, a $39.95 Pro offering, and an officially documented Pro recorder. If a particular advanced page is the sole reason for paying, its availability on the intended platform deserves confirmation rather than an assumption based on the broadest published feature list.
TMOG’s native design supports a common workflow, not identical hardware data
Plummer’s architecture claim is specific. Windows uses C++ and Win32, macOS uses Swift and AppKit, and Linux uses C++ with Qt 6. The official site says all three share a C++20 measuring core, without Electron, a web view, or an embedded browser.
That explains how TMOG can pursue a common diagnostic model while using different platform interfaces. Windows gets native controls and Windows-oriented process and service actions. The Mac application uses Apple’s native application framework. Linux uses Qt Widgets, with the site describing metrics support across X11 and Wayland desktop environments.
A shared core is useful to someone moving between operating systems because consistent models and metric meanings can reduce the work of interpreting each interface. The common trace format extends that idea to recorded sessions. Neither claim establishes remote collection, centralized administration, or automatic aggregation of multiple machines, however. TMOG is documented here as a set of native monitoring applications, not as an enterprise observability service.
Native code also does not prove low overhead. There are no comparative measurements in the available reporting showing TMOG’s CPU use, memory consumption, or effect on battery life against Windows Task Manager. A more useful documented capability is TMOG’s optional self-monitoring: enabling it includes the monitor’s own process so the user can inspect its resource cost. The release notes additionally mention selectable visual frame rates, although they do not quantify the performance difference between settings.
Hardware visibility remains the more consequential limitation. TMOG describes energy readings that include instantaneous watts, history, power state, and associated processes, together with thermal information such as CPU hotspot readings and thermal pressure. Its documentation expressly warns that behavior, functionality, and sensor availability vary by platform and system. A screenshot from another machine therefore establishes what that configuration can expose, not what every Windows laptop will report.
Plummer also makes a clear privacy promise: TMOG sends no usage statistics, hardware inventory, process information, or identifiers, and its only routine network request is an update check. That is a vendor statement, not an independently audited finding. It is still relevant information for an administrator assessing the application, provided it is not expanded into claims about offline operation, trace-file contents, or security guarantees that the documentation does not make.
Windows 11 Task Manager remains a useful baseline
The sensible comparison starts with what Windows already supplies. Thurrott’s Windows 11 24H2 field guide documents built-in Task Manager views for processes, performance, app history, startup applications, users, process details, and services. Its Performance view covers CPU, memory, disks, networking, graphics processors, and NPUs where available. Windows users do not need a third-party purchase simply to see which application is consuming CPU time or memory.
For a basic live check on Windows 11, the documented workflow is short:
- Press
Ctrl+Shift+Escto open Windows Task Manager. - Select Processes to examine running applications and background processes.
- Select a resource column, such as CPU or Memory, to sort by that measurement.
- Use Performance to inspect the corresponding system-level graph.
- Hold
Ctrlwhile viewing Processes if you need to temporarily freeze the changing list.
That baseline helps define where TMOG earns an installation. Its documented additions emphasize more integrated system information, explicit unavailable states, energy and thermal analysis where supported, cross-platform consistency, and saved telemetry replay in Pro. Those are more meaningful reasons to evaluate it than an unsupported assertion that Microsoft’s utility has become inadequate.
Administrative actions should remain a separate decision from observation. Ending a process can discard unsaved work; finding a busy process is not sufficient reason to terminate it. TMOG’s process-identity safeguard addresses which process an action targets, not whether taking that action is appropriate. Neither interface turns a resource spike into permission to stop a service indiscriminately.
Windows’ built-in utility also supplies an immediate fallback while TMOG is being evaluated. The documented TMOG release does not require readers to give up Task Manager, and there is no evidence here that installing TMOG automatically replaces Windows shortcuts or system entry points. Keeping both available is a practical way to assess the new application without treating beta software as the sole source of diagnostic information.
Evaluate TMOG’s readings before buying its recorder
Start with the free edition on the actual machine you want to troubleshoot, and establish whether its available measurements address your problem before paying for recorded replay. That sequence follows directly from TMOG’s platform-dependent sensor coverage: the value of a more capable recorder still depends on the usefulness of the information being recorded.
For a Windows user, the first checks are the processor architecture and application version. Select the x64 or Arm64 package appropriate to the PC. If evaluating the particular temperature issue described in the release notes, distinguish Windows 0.1.5 from 0.1.4; the hotfix has a specific purpose, while Mac and Linux remaining on 0.1.4 is expected.
The most concrete takeaways are:
- Treat Windows 11 x64 and Arm64 as the documented Windows targets; do not assume Windows 10 or Windows Server compatibility.
- Expect the Windows Beta3.1.1 release to be version 0.1.5, while the documented macOS and Linux Beta3.1 releases remain version 0.1.4.
- Interpret unavailable readings and gaps as missing evidence, not as zero usage or proof that a subsystem was inactive.
- Evaluate the free edition’s sensor coverage and use its self-monitoring option to inspect the application’s own resource cost.
- Consider the $39.95 Pro edition when saving and replaying telemetry addresses a real troubleshooting need, while confirming any other must-have paid view and the applicable license terms.
- Keep Windows Task Manager available for familiar live checks and administrative work during the beta evaluation.
TMOG’s strongest contribution is a more explicit approach to measurement: preserve process identity, distinguish absence from zero, and make recorded behavior available for later inspection. Its Windows release gives PC users a concrete opportunity to evaluate that approach rather than admire a demonstration. For now, the informed decision is to judge the free beta against the machine’s real sensor coverage, then pay for Flight Recorder only if revisiting captured slowdowns would improve the work.
Update: Plummer says Claude Code helped build TMOG in under six weeks (September 22, 2026)
According to Engadget, Dave Plummer says TMOG was developed in under six weeks with two collaborators and Claude Code doing much of the implementation work. He reportedly began with a 107-page specification rather than relying on an unstructured prompt, arguing that a task manager needs detailed requirements to avoid unreliable results.
The report also reinforces that the current builds remain beta software: Plummer says early users are still finding bugs. That makes the existing advice to retain Windows Task Manager during evaluation more pertinent, particularly for users considering TMOG for administrative actions rather than observation alone.
Engadget further reports that TMOG is not distributed through Apple’s App Store because macOS sandboxing would prevent an app from enumerating system processes or terminating other applications. That limitation concerns Mac distribution rather than the Windows release, but it helps explain why the project uses direct downloads across platforms.
References
- Dave Plummer Has Made the Task Manager of Your Dreams - Thurrott.com Thurrott.com · 2026-09-21T19:20:32+00:00
- Release Notes — Task Manager TMOG tmog.org
- Task Manager (24H2) thurrott.com