

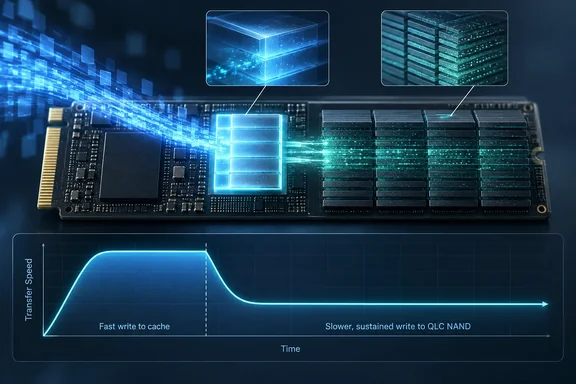
For Windows users, the important distinction is between burst performance and sustained performance. A headline write speed describes neither an unlimited transfer nor every possible drive state. Intel’s own performance-evaluation guide warns that filling an SSD and running benchmarks back-to-back can leave its SLC cache saturated, affecting subsequent results.
One SSD, two ways of using its flash
QLC means quad-level cell: each NAND cell stores four bits, represented by 16 distinguishable states. SLC stores one bit per cell. Micron’s technical explanation illustrates why greater density requires more precise differentiation between stored charge levels. More data fits into the same number of cells, but the storage task becomes more demanding.
Pseudo-SLC caching exploits that tradeoff. Instead of immediately using selected cells at their full multi-bit density, the controller operates them in one-bit mode to absorb incoming writes faster. Intel’s 660p architecture combines a static SLC region with unused QLC NAND temporarily configured as SLC. The controller subsequently consolidates cached data into denser storage.
The capacity arithmetic is straightforward: cells holding one bit have one-quarter of their four-bit-mode capacity. In a purely theoretical example, cells capable of storing 1TB in QLC mode would hold 250GB in one-bit mode, using decimal units. That is a density illustration—not a promise that a 1TB SSD provides a 250GB cache. Actual allocation follows the controller’s policy, as Intel’s much smaller 660p cache figures demonstrate.
Think of it as a warehouse with a fast receiving area, not a second warehouse hidden behind the first.
Why the fast region gets smaller
Dynamic caching borrows from available NAND. Keeping more data on the drive can leave less room for that temporary fast region; reducing stored capacity can allow it to expand again. Intel’s architecture presentation explicitly shows both directions of adjustment. This is capacity-dependent behavior, not simply a cache that deteriorates with age.
The historical Intel 660p provides a particularly useful example. A 2018 Shrout Research white paper hosted by Intel gives the following available-cache figures for the 1TB model:
| Used drive capacity | Available SLC cache |
|---|---|
| 0–25% | 140GB |
| 25–35% | 127GB |
| 35–45% | 102GB |
| 45–55% | 76GB |
| 55–65% | 50GB |
| 65–75% | 25GB |
| More than 75% | 12GB |
These figures describe that product’s architecture, not a universal QLC formula. They also clarify an important point: the cache does not simply remain at 140GB until the drive is nearly full and then abruptly become 12GB. Its available capacity declines through intermediate stages.
The practical takeaway: an empty-drive benchmark can reveal a very different write experience from the same SSD carrying a substantial library of files.
The HP FX700 illustrates the write-speed cliff
XDA’s explanation highlights a sustained-write test attributed to TechPowerUp’s review of the 2TB HP FX700. According to that reporting:
- Initial writing approached 5GB/s.
- After approximately 54GB, throughput fell to roughly 3.5GB/s.
- After around 460GB, the cache was exhausted and throughput dropped to approximately 130MB/s.
Those measurements are a reported result for one capacity and test, not independently reproduced measurements here. TechPowerUp’s component inspection identifies its reviewed FX700 as a PCIe 4.0 x4 drive using YMTC 232-layer QLC NAND and a Maxio controller, without onboard DRAM.
The dramatic final number needs boundaries. It describes post-cache sequential writing in that workload—not normal performance for every transfer, every QLC SSD, or every FX700 capacity. It also does not establish that reading existing files suddenly falls to the same rate. Intel’s documentation similarly separates sequential-read specifications from the cache-state considerations that affect write testing.
Cache exhaustion is not permanent damage
The claim that buying another drive is the only remedy goes too far. Cache saturation is a workload condition. Intel’s evaluation guide specifically calls for flushing the cache between relevant tests to restore consistent conditions, demonstrating that saturation need not be permanent.
There is another nuance: cache size is not necessarily a fixed maximum transfer size. Background consolidation can reclaim space while data arrives. The Shrout Research white paper explains that slower incoming writes can allow the cache to accommodate more total data than its nominal capacity suggests. How successfully that happens depends on the particular drive and workload.
The supported practical response is therefore to distinguish two situations:
- Temporary saturation: allow background work to complete before another demanding transfer.
- A smaller dynamic cache caused by high occupancy: reducing stored data can increase the available cache allocation on architectures that support it.
Neither action changes the underlying NAND’s sustained-write capability, and neither provides a universal recovery time.
TLC is not a cache-free escape hatch
Moving to TLC does not mean abandoning this technique. Samsung’s documentation identifies the 870 EVO as a TLC SSD and describes its Intelligent TurboWrite technology as using a variable SLC buffer. That is a concrete counterexample to the idea that fast-cache behavior belongs only to cheap QLC drives.
Consequently, “QLC versus TLC” is useful background, but not a complete purchase decision. The stronger question is: how does this exact model behave after its cache stops carrying the workload? Intel’s testing guidance reinforces why occupancy and cache preparation must be considered when comparing results.
What to look for before buying
Based on those documented behaviors, a useful SSD-review checklist is:
- Match the capacity. Different capacities can have different cache allocations.
- Look beyond a short benchmark. Find sustained-write results that extend past the fast region.
- Check drive occupancy. Empty and partly filled tests answer different questions.
- Look for recovery conditions. Back-to-back writes can produce different results from transfers separated by idle time.
- Separate reads from writes. A write-cache cliff is not a complete description of SSD performance.
These are analytical conclusions from Intel’s architecture and benchmarking documentation, rather than claims of firsthand testing.
A capacity-first QLC drive can still be a sensible choice: Intel positioned the 660p for mainstream and entry-level computing, while Micron identifies QLC with high-density, cost-sensitive storage. The tradeoff deserves closer scrutiny when sustained writing is central to the job.
The bottom line: the “two drives” metaphor captures a real performance contrast, but obscures the mechanism. There is one SSD, a controller-managed fast region, and a sustained-write capability that marketing’s biggest number may not reveal. Buy for the workload after the sprint—not just the sprint itself.
References
- Every cheap QLC SSD is secretly two drives, and the fast one gets smaller the more you fill it XDA · 2026-10-03T16:00:20+00:00
- Intel® QLC Technology Built for the PC. Capacity at an Amazing Price. intel.com
- Performance and Price That Matters intel.com