

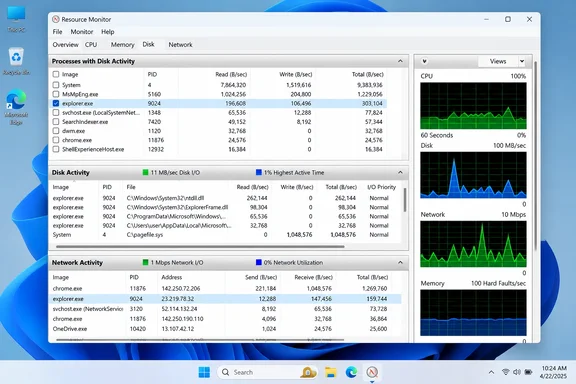
What Resource Monitor is, and what it isn't
Resource Monitor is not new. It has been part of Windows since Vista and shows real-time use of CPU, memory, disk and network resources, plus software resources such as file handles and modules. The reviews and guides we found describe it as a window onto what is happening at this moment.
That distinction matters. Microsoft's Windows Server training separates Resource Monitor, which tracks current process-level CPU, disk, network and memory use, from Performance Monitor. Performance Monitor is the tool for real-time and historical analysis, custom data collector sets, baselines and trend analysis. Resource Monitor does not give you long-term history, alerting or custom dashboards. Neither the source article nor the Microsoft material establishes hardware temperature or GPU coverage either. Patel himself concedes that he would look elsewhere for advanced hardware monitoring, long-term statistics or highly customized dashboards.
How to open it
Any of these works:
- Select Start, type
resmonor "Resource Monitor", and choose it from the results. Microsoft's high-CPU troubleshooting guidance uses this method. - Press Win + R, type
resmonand press Enter. This is the method Patel uses. - Run
perfmon /res. Microsoft's command reference documents this switch as starting the Resource View. The same page lists Windows 10 and Windows 11 as applicable. - Open Task Manager, go to the Performance tab, and use the Open Resource Monitor link at the bottom.
No installation or account is needed. The window opens on an Overview tab, and the other tabs are CPU, Memory, Disk and Network.
A practical workflow for a sluggish PC
- Start on the CPU tab. Microsoft's guidance says to maximize the window if you can't see all the data. Click the Average CPU column header, with the arrow pointing down, to put the heaviest consumers at the top. Microsoft frames the top entries as the first ones to consider if they exceed what you expect for your environment.
- Select a process, don't just kill it. Ticking a process filters the other tabs to that process. Selecting a process under CPU makes Resource Monitor list only that process's disk, network and memory usage. That filtering is the feature that most clearly separates it from Task Manager's flatter list.
- Check the Disk tab if things feel slow. It shows which processes are reading or writing. The Disk Activity table lists the specific file paths being accessed, with read, write and total throughput. This is useful when the drive light is pinned and you want to know why.
- Check the Network tab for unexpected chatter. It has sections for Processes with Network Activity, Network Activity, TCP Connections and Listening Ports. TCP Connections shows local and remote addresses and ports, and Listening Ports shows the addresses and ports each process is waiting on. Select a process and these tables narrow to just its connections.
- Use the Memory tab for apps that bloat over time. Per-process memory use helps you spot an application that grows the longer it stays open.
Reading the results carefully
A process at the top of a list is a lead, not a verdict. High CPU or disk use can be a symptom of something else, such as a driver, an update, an antivirus scan or a failing disk. Microsoft's high-CPU guidance reflects this. It treats Resource Monitor as one step, then points to Performance Monitor logs, Windows Performance Recorder traces and ProcDump captures for harder cases. It also warns that a brief CPU spike is normal and that sustained usage is the thing to chase.
The Network tab has similar limits. It shows which process holds a connection and where it is connecting. It is not a packet-capture or network-forensics tool, and Patel says as much. If a connection looks suspicious, treat it as a prompt to investigate the process. Don't treat it as proof of malware.
Resource Monitor versus Task Manager versus paid tools
- Task Manager: Microsoft Support describes it as the built-in monitor for CPU, memory, disk and network use, plus startup and process management. It is quicker for a glance and for ending unresponsive programs.
- Resource Monitor: It adds per-file disk activity, TCP connections, listening ports and cross-tab process filtering. It is better for working out why something is slow.
- Performance Monitor and paid tools: These are where you go for history, baselines, alerts, fleet-wide visibility and polished dashboards. That is the gap the "outperforms every paid monitor" headline glosses over.
It is also not a recent development. A 2024 reader comment on a Microsoft AskPerf post says the app hasn't changed in any meaningful way over the last decade. The same commenter complained about the lack of settings and a help file. That is one person's view, but it fits Patel's own point that the interface looks dated. Dated is not the same as limited. For a home user or a help-desk technician who needs an answer in two minutes, the tool that is already installed is hard to beat.
Bottom line
Resource Monitor won't replace an enterprise monitoring suite, and nobody has demonstrated that it outperforms paid tools in general. But as a live, local troubleshooting window, it is free, already on the PC, and more detailed than Task Manager. Next time Windows feels sluggish, run resmon, sort by Average CPU, and click a process to see what it is doing.
References
- Your Windows PC has a free tool that outperforms every paid system monitor, and nobody knows about it XDA · 2026-10-04T17:30:20+00:00
- Using Resource Monitor to Troubleshoot Windows Performance Issues Part 1 | Microsoft Community Hub techcommunity.microsoft.com
- Guidance for troubleshooting high CPU usage - Windows Server | Microsoft Learn learn.microsoft.com