October Cloud Outages: Azure Front Door Misconfig and AWS DynamoDB DNS Failures

  • Thread Author
A sweeping cloud failure on October 29 knocked major Microsoft services and a long tail of customer sites offline, and came on the heels of a separate Amazon Web Services disruption earlier in October — together the incidents laid bare the concentrated fragility of modern cloud infrastructure and forced companies to scramble through mitigation playbooks as millions of users experienced sign‑in failures, blank portals and interrupted commerce. Microsoft traced the most recent outage to an inadvertent configuration change in Azure’s global edge fabric, Azure Front Door, and rolled back to a last‑known‑good configuration while rerouting traffic and recovering nodes; the company’s public updates and independent monitors reported widespread but progressively improving service restoration over several hours.

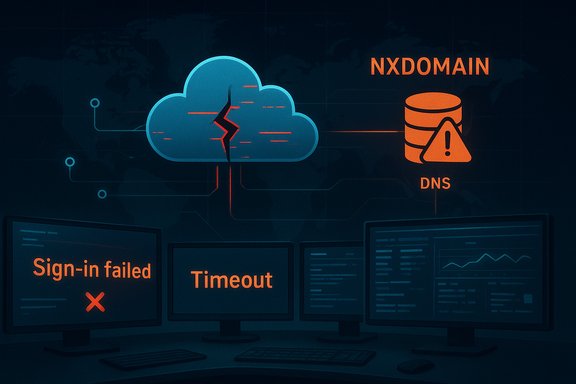
Cloud outage causing sign-in failures, timeouts, and DNS NXDOMAIN.Background / Overview​

The two outages in October are not isolated curiosities — they are symptoms of how the internet’s critical rails have consolidated around a few hyperscale providers. Amazon Web Services (AWS) remains the largest cloud provider and its US‑EAST‑1 region (Northern Virginia) continues to act as a de facto global hub for many control‑plane primitives and managed services. On October 20 an AWS incident tied to DNS resolution and DynamoDB endpoint failures cascaded into elevated error rates and long recovery tails for dozens of platforms. Microsoft’s October 29 outage instead implicated Azure Front Door (AFD), a globally distributed, Layer‑7 application delivery and edge routing fabric that terminates TLS, applies WAF rules, and provides global failover and caching. Because AFD fronts identity endpoints, management portals and countless customer workloads, a control‑plane misconfiguration can induce near‑simultaneous failures across otherwise independent products. Microsoft’s mitigation playbook — freeze further AFD changes, deploy a known‑good configuration, isolate troubled Points of Presence (PoPs), and recover healthy nodes — is textbook for large control‑plane incidents, but the internet’s caching and routing convergence means visible symptoms can linger even after the root change is corrected.

What happened — concise timelines​

Microsoft Azure (October 29)​

  • Microsoft’s incident began in the mid‑afternoon UTC window on October 29, with initial customer‑visible errors and sign‑in/portal failures appearing around 16:00 UTC. The company reported that an inadvertent configuration change to Azure Front Door was the trigger and initiated a rollback to its last known good configuration while blocking further customer configuration changes to AFD. Recovery work included rerouting management traffic away from affected AFD nodes and progressively bringing healthy PoPs back online.
  • Visible symptoms included sign‑in failures for Microsoft 365, access problems with the Azure management portal, interruptions to Outlook web access and Teams, and authentication problems for Xbox Live and Minecraft. Many third‑party sites that rely on Azure’s edge also reported timeouts and errors as AFD nodes momentarily returned incorrect routing or DNS answers. Telemetry from independent monitors showed packet loss and routing anomalies inside Microsoft’s network during the event.
  • Public outage‑tracking services recorded a range of complaint volumes: some live reports cited tens of thousands of user complaints for specific Microsoft properties in the worst minutes, while other aggregated trackers recorded different peaks depending on the service. Microsoft’s public advisories and third‑party monitors indicated recovery progressed over hours as the last‑known‑good configuration completed deployment and caches and DNS resolvers converged.

Amazon Web Services (October 20)​

  • On October 20 AWS experienced a region‑level disruption centered on US‑EAST‑1; engineers identified DNS resolution problems affecting the DynamoDB API as a proximate symptom, leading to increased error rates and cascading failures across dependent services. DNS failures prevented client SDKs and internal services from locating the DynamoDB endpoint, triggering retry storms, throttles and long tails of backlog processing.
  • The outage affected a broad cross‑section of consumer and enterprise platforms — streaming, messaging, gaming, banking portals and AI tools all reported partial or total failures during the event. Recovery required restoring DNS resolution, throttling retry storms, draining queued work, and repairing control‑plane state that had become inconsistent during the failure window. Independent analyses documented how DynamoDB’s role as a low‑latency metadata store and dependencies like EC2’s internal lease manager extended the recovery well beyond the DNS fix.

Services and sectors hit​

The outages rippled into both consumer and enterprise systems. Representative, verified impact included:
  • Microsoft 365 web apps and sign‑in services, Outlook and Teams experienced access problems during the Azure incident.
  • Xbox Live and Minecraft authentication and multiplayer services were disrupted for many players.
  • Azure Portal and Azure management blades became intermittently inaccessible, complicating remediation for cloud customers.
  • LinkedIn and other Microsoft‑adjacent properties saw intermittent issues as identity and routing paths were affected.
  • Alaska Airlines reported website and mobile app problems tied to the Azure outage; earlier in October it had suffered a separate technology outage that grounded flights and pressured its share price. Reuters reported Alaska Air Group shares declined about 2.2% after earlier IT disruptions.
  • During the AWS disruption, platforms such as Snapchat, Reddit, Fortnite, Duolingo, Canva, Venmo and others reported outages or degraded service as DynamoDB‑dependent operations failed or slowed.
Public outage trackers logged anywhere from the low thousands to well into the tens or hundreds of thousands of reports depending on the service and time window cited by different outlets; those numbers vary by tracker, the set of monitored services, and per‑service peaks (for example, a single consumer app may show a much higher spike than an aggregated Microsoft property).

Technical anatomy — how a single change or a DNS glitch becomes systemic​

Azure Front Door: control‑plane risk and global blast radius​

Azure Front Door is more than a CDN — it’s a globally distributed, Anycast‑based application ingress and edge fabric responsible for TLS termination, Layer‑7 routing, WAF, caching and global failover. Because it fronts identity token endpoints (for Entra ID), the Azure Portal and many Microsoft first‑party services, a misapplied routing or validation change can simultaneously break token exchange flows, TLS handshakes or DNS resolutions across many products. That single‑change blast radius is exactly what independent reconstructions and Microsoft’s status updates described for the Oct 29 event. Even after a rollback, distributed caches and DNS resolver TTLs keep stale answers circulating, producing a residual “tail” of symptoms that complicates recovery. Key technical observations:
  • AFD configuration is propagated rapidly to many PoPs; a faulty validator or a software defect in the control plane can cause wide distribution of the bad state.
  • Identity token endpoints and management portals often rely on AFD; when AFD misroutes or returns errors, authentication and management surfaces fail.
  • Internet‑wide cache and DNS convergence extend observable disruption beyond the time the control plane is fixed.

AWS DynamoDB / DNS: the invisible hinge​

On October 20 AWS public updates homed in on DNS resolution for the DynamoDB API in US‑EAST‑1 as the proximate technical symptom. DNS failures are deceptively catastrophic inside cloud platforms: when a high‑frequency API name fails to resolve, SDKs and services can’t reach otherwise healthy servers, retries amplify load, throttles kick in, and internal orchestration systems (for example EC2’s lease managers) can enter inconsistent states that take hours to reconcile. Independent telemetry and DNS recovery analyses confirmed that restoring DNS answers was a necessary but not sufficient step; backlogs, lease inconsistencies and health‑check failures extended impact well into a multi‑hour recovery window. Technical takeaways:
  • DNS and service discovery are keystone dependencies for modern distributed systems; they require hardened deployment pipelines and robust rollback controls.
  • Managed primitives that appear trivial (session stores, small metadata tables) are often on critical paths; their availability must be architected with explicit cross‑region replication and failover validation.
  • Retry strategies without jitter and throttling controls can amplify aversive conditions into broader outages.

Why these incidents matter — systemic risks and business impacts​

The practical and strategic consequences of these outages are widespread:
  • Operational disruption: Enterprise admins and SRE teams lost access to management portals and had reduced ability to perform hot fixes, complicating incident response. The inability to perform administrative tasks inside the cloud provider during platform outages is a recurring pain point.
  • Customer trust and revenue: Consumer‑facing services saw interruptions in commerce, communications and gaming — all revenue‑critical or reputation‑critical touchpoints. Airlines and retailers that depend on cloud‑fronted ticketing, check‑in or POS experienced booking and boarding friction. Reuters and AP reported airline and retail impacts tied to these outages.
  • Market reaction and regulatory scrutiny: Recurrent, high‑profile outages draw investor attention and can depress stock prices for directly affected companies; they also increase pressure from regulators and large customers to improve transparency, SLAs and post‑incident analyses. Reuters noted investor reactions around prior Alaska Air technology issues.
  • Hidden supply‑chain fragility: The events underscore that modern services are built on nested managed primitives. A single misconfiguration in a global edge fabric or a DNS resolver bug can cascade through dozens of vendors and customers.

Strengths demonstrated by the providers — and where they fell short​

Microsoft and AWS both demonstrated solid incident‑response fundamentals: rapid detection, public status updates, coordinated deployment of mitigations (AFD rollback in Microsoft’s case; DNS mitigations and throttles in AWS’s case), and staged reintroduction of healthy infrastructure. Their scale and operational experience make these responses possible and helped limit the outage windows to hours rather than days. However, the incidents also revealed persistent weaknesses:
  • Single‑change blast radius: Acceptance of a problematic control‑plane change that propagated globally is a classic failure mode. Validation, pre‑flight checks and tighter staged rollout policies could limit reach.
  • Soft‑dependencies buried in control planes: Reliance on a regional control‑plane primitive (for example DynamoDB metadata stores or Route 53 internal resolvers) without demonstrable hot‑standby cross‑region resilience amplifies single points of failure.
  • Cache and DNS convergence: Even a correct rollback doesn’t instantly restore global availability due to TTLs and distributed caches — a reality operators must plan for in communications and recovery timelines.

Practical resilience playbook for Windows admins and SREs​

Enterprises and platform engineers can and should take concrete steps to reduce outage impact. The following recommendations are pragmatic and ordered:
  • Design for graceful degradation
  • Treat managed primitives (managed NoSQL, identity, CDN) as potentially transient. Implement client‑side fallbacks: offline caches, degraded UX and read‑only modes.
  • Multi‑region and cross‑provider failover where business critical
  • For critical workloads, replicate control‑plane metadata across regions and, where feasible, across providers to avoid a single‑vendor choke point.
  • Harden DNS and service discovery
  • Cache judiciously, use resolvers with proven synchronization patterns, and deploy jittered exponential backoff with capped retries to avoid storming resolvers.
  • Test administrative access alternatives
  • Ensure documented and tested out‑of‑band management paths exist so admins can recover or reconfigure when the provider’s primary management portal is unreachable.
  • Chaos engineering and runbooks
  • Regularly inject failures that mimic control‑plane misconfigurations and DNS anomalies; validate incident response, rollback and customer communications.
  • Contractual and observability upgrades
  • Negotiate transparent post‑incident reports and SLAs where possible; instrument application stacks to show whether the fault is internal, provider‑side, or a dependency cascade.
  • Financial and business continuity planning
  • Quantify outage exposure in terms of revenue, legal risk and customer experience; ensure insurance and communication templates are ready.
  • Benefits of these steps include improved uptime, more predictable recovery windows, reduced customer churn and clearer incident communications.

Governance, transparency and the case for better post‑incident reporting​

Both outages will be scrutinized in post‑incident reviews, and there’s a growing industry call for more detailed, timely public post‑mortems from hyperscalers. Operators and customers need:
  • Specific timelines of trigger events and validation failures.
  • Clear lists of what systems were impacted and why (control‑plane vs data‑plane).
  • Concrete remediation actions and timelines for preventing recurrence.
Microsoft’s public status updates noted an inadvertent AFD configuration change and described the rollback and node recovery steps; independent monitors provided complementary diagnostics about routing and caching behavior. AWS’s statements and independent analyses similarly focused on DNS and DynamoDB endpoint issues. But customers and regulators increasingly demand deeper technical transparency and faster, more actionable advisories during incidents.

Risk‑management tradeoffs: multi‑cloud, complexity and cost​

Multi‑cloud is not a panacea. It introduces complexity, operational overhead and data‑consistency challenges. Yet not multi‑cloud can concentrate risk. The right approach is intentionally hybrid:
  • Reserve multi‑cloud for critical services where downtime cost exceeds the complexity premium.
  • Maintain policies and tooling to run graceful degraded experiences across providers and on‑premise during major provider incidents.
  • Rationalize what truly needs cross‑provider replication versus what can tolerate provider dependence.
Engineering teams should avoid false confidence in “automatic” failover and instead verify failover paths under realistic load and data‑consistency conditions.

What providers are doing and what to watch for next​

Microsoft said it blocked further AFD changes while mitigation continued and deployed a last‑known‑good configuration to restore services; servers and PoPs were progressively recovered and traffic rerouted as the mitigation completed. Observers should look for Microsoft’s formal post‑incident report that clarifies precisely what validation or change‑control gap allowed the misconfiguration to be accepted. AWS has described DNS resolution for DynamoDB APIs as a central symptom of the earlier US‑EAST‑1 incident and is expected to publish deeper root‑cause analysis that explains how resolver state, zone transfers or edge resolver sync issues propagated a SERVFAIL/NXDOMAIN condition across resolvers. Engineering teams should watch for design and deployment changes in Route 53 internal resolver architecture, retry behavior in SDKs, and improvements to cross‑region control‑plane redundancy.

Conclusion — a pragmatic reality check​

These recent outages are a sobering reminder: cloud scale gives enormous capability, but with that capability comes concentrated systemic risk. Hyperscalers will continue to reduce incidents and improve controls, but operators and business leaders cannot outsource resilience. Practical resilience — multi‑region replication for critical control data, rigorous change‑validation for control planes, robust DNS and retry hygiene, tested administrative fallbacks and clear incident communications — remains a business imperative.
The October incidents offer hard lessons for architects and IT leaders: harden the invisible dependencies, test the administrative escape hatches, and assume that a configuration change or DNS anomaly at a hyperscaler can course through customers and suppliers in unpredictable ways. Firms that absorb these lessons and convert them into controlled redundancy, observability and realistic runbooks will be better positioned to protect customers, revenue and reputation the next time the cloud wobbles.
Source: Zoom Bangla News Major Cloud Outage Hits Microsoft Azure and Amazon Web Services
 

Microsoft is testing a new built‑in safeguard in Windows 11 Insider Preview that will prompt users to run a memory scan after a system crash, automatically scheduling the Windows Memory Diagnostic on the next reboot to quickly check for RAM‑related faults and report results back to the desktop.

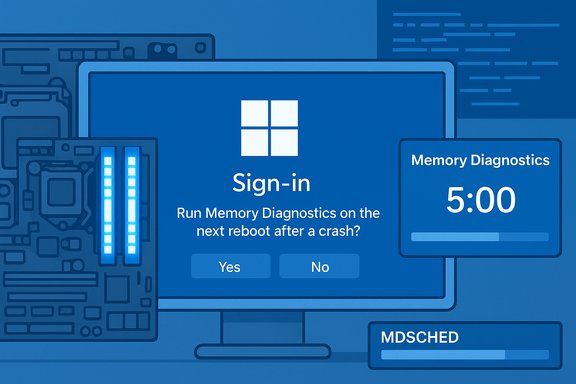
Windows sign-in prompts to run Memory Diagnostics on the next reboot; progress bars visible.Background​

Memory failures are among the most treacherous causes of system instability. They can produce symptoms that mimic driver bugs, software corruption, or storage faults, and they frequently produce intermittent, hard‑to‑reproduce crashes that confound troubleshooting. To tackle this category of failures more proactively, the latest Windows 11 Insider Preview builds introduce a feature called Proactive Memory Diagnostics — an automated workflow that surfaces after an unexpected restart (a bugcheck) and offers to run a quick memory test at the next boot.
This feature is being rolled out in early flights of the Insider program and is designed to make the existing, built‑in Windows Memory Diagnostic experience easier to trigger for everyday users. Initial testing indicates the diagnostic run usually completes in about five minutes on average, though actual duration scales with installed RAM and system configuration. The implementation is deliberately conservative in scope for now, with platform and configuration exclusions in place and a plan to narrow which crash signatures prompt the scan as telemetry and engineering analysis mature.

What Proactive Memory Diagnostics does — and how it works​

The new crash-to-scan workflow​

  • When Windows detects a bugcheck (unexpected restart, BSOD/Black Screen reboot), the OS may display a prompt at sign‑in suggesting a memory scan.
  • If the user opts in, the system schedules the familiar Windows Memory Diagnostic (mdsched.exe) to run on the next reboot.
  • The diagnostic executes before Windows fully loads, runs a standard suite of memory tests, and then reboots back into the OS.
  • If the test finds issues and the system can mitigate them (for example, by isolating a fault or providing a clear error report), Windows will surface a post‑boot notification to the user with the outcome.
This is effectively a friction‑reduction layer on top of an existing, long‑standing diagnostic tool: the operating system proposes the check automatically, schedules it for the next boot, and ties the result back into the login experience. The goal is to catch common or obvious memory faults quickly without requiring users to know and run mdsched.exe manually.

Typical timing and what “five minutes” means​

The early documentation and engineering notes describe the scan as taking about five minutes on average, with the caveat that time scales with memory size and test configuration. In practice:
  • Systems with modest RAM (8–16 GB) running the default/standard test complete far more quickly than systems with 32 GB or more.
  • Users or advanced operators can still invoke extended or more rigorous testing manually; the automated prompt uses the standard test to minimize reboot time and user disruption.
  • The average time metric is presented as a user‑experience target rather than a strict guarantee — real world durations vary by memory capacity, CPU speed and whether the platform allows the extended passes.

What the diagnostic actually checks​

The scheduled test launches the existing Windows Memory Diagnostic engine which performs multiple algorithmic checks across RAM address ranges, including basic read/write patterns and several test algorithms designed to expose address line faults, stuck bits, and single‑bit errors. By default, the system runs the standard suite; more comprehensive test modes remain available via manual controls at boot if the user presses the appropriate key to access advanced options.

Why this matters: practical benefits for users and admins​

Faster first‑line detection​

For many users, memory testing is an obscure, last‑resort task. The automated suggestion lowers that barrier and can catch simple hardware failures quickly, reducing time spent chasing misleading driver or software fixes.
  • Casual and mainstream users benefit because the OS suggests the test right after the symptom (a crash), increasing the likelihood that hardware is checked early.
  • Support technicians and help desks get better triage information when customers have already run a baseline memory scan.

Reduces misdiagnosis and repair churn​

Memory issues often cause support cases to bounce between OS reinstallation, driver updates, and application troubleshooting. A quick, post‑crash memory check reduces this diagnostic back‑and‑forth by eliminating or confirming RAM as the root cause earlier in the process.

Useful telemetry for engineering​

During early flights, the feature intentionally triggers for all bugcheck codes. That broader sweep helps engineers collect correlations between specific crash codes and underlying memory corruption, enabling them to refine the heuristics that determine when the scan should be suggested in later builds. Over time, the system will narrow triggers to only those crashes that telemetry indicates are plausibly memory‑related.

Limitations, exclusions, and current constraints​

Platform and configuration exclusions​

The initial preview explicitly excludes certain configurations:
  • Arm64 systems are not supported in this early flight.
  • Systems configured with Administrator Protection are excluded.
  • Devices that have BitLocker enabled without Secure Boot do not see the experience.
These exclusions appear to be temporary limitations tied to implementation complexity, pre‑boot environment constraints, or security considerations while the feature is under test. Expect platform support to expand after additional validation and engineering adjustments.

Not a replacement for exhaustive testing​

The Windows Memory Diagnostic — and by extension Proactive Memory Diagnostics — is intended as a quick sanity check, not as a thorough, forensic memory analysis. For intermittent or subtle errors, more intensive tools are still recommended:
  • Bootable third‑party solutions designed for deep testing (for example, industry‑standard memory testers) run extensive test patterns and multiple passes across hours or overnight and are far more likely to reveal intermittent hardware faults.
  • Advanced users and technicians should still rely on those tools when the quick diagnostic reports no issues but instability persists.

False negatives and intermittent errors​

Memory faults can be intermittent, manifesting only under particular workloads, timings, or environmental conditions (temperature, voltage, XMP/overclocking). A single quick pass may not reproduce those conditions, so a clean result does not prove the memory is flawless.

Privacy, telemetry and data collection caveats​

Any feature that ties crash telemetry to targeted diagnostics raises questions about what data is collected and how it's used. The present design appears to use crash signatures to decide whether to prompt a memory check during testing, but the privacy posture — which fields are logged, whether raw memory contents or low‑level addresses are transmitted, and what telemetry is retained — will need explicit documentation and transparency for enterprise deployments.

How this compares to traditional memory testing tools​

Quick built-in test vs deep external testing​

  • Windows Memory Diagnostic (built into Windows)
  • Pros: Easy to run; integrated; scheduled at next boot; minimal user knowledge required.
  • Cons: Limited test coverage by default; may miss subtle or intermittent errors.
  • Bootable, third‑party testers (industry standard)
  • Pros: Much broader algorithmic coverage; designed to run for many passes; runs outside the OS so there’s no interference from drivers or the scheduler.
  • Cons: Requires creating boot media and more time; less convenient for casual users.
The new proactive orchestration bridges the convenience gap for everyday users by scheduling the built‑in test automatically right after a crash. But for rigorous hardware validation — particularly for servers, professional workstations, or enthusiast overclocked rigs — the bootable, long‑running tools remain the recommended path.

When to escalate to deep testing​

  • If the Proactive Memory Diagnostics run reports an error.
  • If system instability continues despite a clean quick test.
  • If the system is under high stress (e.g., extreme benchmarking, virtualization workloads) and intermittent faults appear.
  • If you suspect electrical or thermal conditions are exacerbating memory instability (overclocking, undervolting, BIOS/UEFI settings like XMP/DOCP).
In those cases, the correct next steps are to run a dedicated bootable memory tester for several passes, test modules individually, and isolate faulty channels.

Recommended troubleshooting workflow (practical, step‑by‑step)​

  • Accept the Proactive Memory Diagnostics prompt and schedule the quick scan on reboot.
  • If the scan reports errors, note the error type and follow the standard hardware steps: power down, reseat modules, test each stick in a known‑good slot, swap modules to isolate the bad stick.
  • If the scan is clean but crashes persist, boot into BIOS/UEFI and disable XMP/DOCP or reset memory to default JEDEC speeds; then retest to see if stability improves.
  • Run a bootable, full‑coverage memory test (industry tool) for multiple passes (overnight) if symptoms continue.
  • Update chipset, memory and platform firmware. Reproduce with minimal drivers and software to rule out software conflicts.
  • For enterprise environments, capture crash dumps and correlate with memory test logs before replacing hardware to avoid unnecessary parts swaps.
This sequence balances convenience and rigor: quick automated checks first, then progressively deeper diagnostics if problems persist.

Enterprise considerations and deployment guidance​

Controlled rollout and feature flagging​

The feature is being rolled out to Insiders under controlled feature rollouts, which means enterprises that also participate in preview testing should expect phased exposure. For managed fleets, administrators will want control over whether users receive the prompt, and whether the system can autonomously schedule pre‑boot diagnostics.

BitLocker, Secure Boot, and pre‑boot security​

Because the experience interacts with pre‑boot operations, devices with encryption or strict pre‑boot configurations may be excluded until the experience can be validated to meet security and compliance requirements. Enterprises that enforce BitLocker, Secure Boot or additional pre‑boot authentication should test the behavior in lab environments before enabling any new feature across production fleets.

Logging, telemetry and compliance​

IT teams should insist on clear documentation of what the feature logs and transmits. For regulated environments, even metadata about crash signatures or diagnostic outcomes may have compliance implications. Ensure vendor documentation addresses telemetry retention, export controls, and administrative controls for disabling or auditing the diagnostic feature.

Risks, edge cases, and things to watch​

User disruption and false alarms​

Automatic prompting after every bugcheck could be noisy during early flights; if not tuned, users might be asked to run repeated checks that add little value. The engineering plan to narrow triggers based on crash signatures is necessary to avoid diagnostic fatigue.

Firmware and driver interactions​

Because memory corruption can appear as driver or kernel faults, there is a risk of misattributing root causes. The diagnostic itself doesn’t replace careful crash dump analysis. Skilled troubleshooting still requires looking at minidumps, drivers, and firmware interactions.

Potential security and integrity concerns​

Scheduling pre‑boot diagnostics on encrypted devices or devices with strict security policies requires careful handling to avoid exposing sensitive state or weakening pre‑boot protections. The current limitations (exclusion of certain configurations) suggest engineers are working to ensure integrity and security before broad rollout.

Hardware lifecycle and replacement policies​

A clean quick test could provide false reassurance. Organizations should not use a single clean Proactive Memory Diagnostics scan as the sole justification to forgo further hardware troubleshooting if instability continues. Replace or test hardware only after due diligence, including longer passes on dedicated test tools when appropriate.

What enthusiasts and technicians should know​

  • This is a convenience feature that automates an existing capability; it does not change the underlying diagnostics technology.
  • Enthusiasts who regularly tweak memory timings or run XMP/DOCP should continue to use long‑running, bootable testers for deep validation.
  • Technicians performing warranty or RMA work can use the automated test as a triage step, but should still follow up with detailed testing before approving hardware replacements.
  • Keep an eye on the Insider channel notes for refinements to which crash codes trigger the prompt; that tuning will materially affect the value of the feature in practice.

The engineering trajectory: what to expect next​

Early indications are that the feature will be refined along two lines:
  • Targeting refinement: Engineering telemetry will be used to identify which bugcheck codes are reliably associated with memory corruption so the OS only suggests diagnostics when the crash signature makes a memory issue plausible. This will reduce unnecessary prompts and make the feature more prescriptive.
  • Platform expansion and hardening: Support for more hardware configurations (including Arm64) and secure‑boot/BitLocker‑protected systems will be validated and added once pre‑boot integrity and security requirements are satisfied.
Expect incremental changes in Insider flights as Microsoft balances user convenience with false positive control and security correctness.

Conclusion​

Proactive Memory Diagnostics is a pragmatic, welcome addition to the Windows troubleshooting toolbox. By surfacing a simple, time‑bounded memory check immediately after a crash, the feature reduces the friction that keeps many users from running basic hardware diagnostics. It’s not a panacea — deep, intermittent memory faults still require bootable, long‑running tests — but for everyday troubleshooting it closes a persistent gap between symptom and first test.
Early engineering choices — broad triggering of scans during testing and temporary platform exclusions — reflect a cautious rollout that prioritizes data gathering and safety. The ultimate value of the feature will hinge on how effectively the triggers are refined and how transparently telemetry and security interactions are handled for enterprise customers.
For users and IT professionals alike, the sensible approach is to treat Proactive Memory Diagnostics as a fast, automated first step in a broader diagnostic playbook: let the OS do the quick scan, but escalate to dedicated hardware testing and crash analysis when uncertainty remains. This balanced workflow will deliver faster resolutions for many common failures without sacrificing the rigor that serious memory problems demand.

Source: Pokde.Net Windows 11's Proactive Memory Diagnostics Aims To Fix Memory-Related Crashes - Pokde.Net
 

Microsoft confirmed it has rolled out a remediation after a global Azure outage on October 29 that left Microsoft 365, Xbox/Minecraft sign‑ins, the Azure management portal and a wide swath of customer websites intermittently unreachable — an incident Microsoft says was triggered by an inadvertent configuration change in Azure Front Door, its global edge and application delivery fabric, and that was mitigated by freezing configuration rollouts and rolling back to a “last known good” configuration while recovering affected edge nodes.

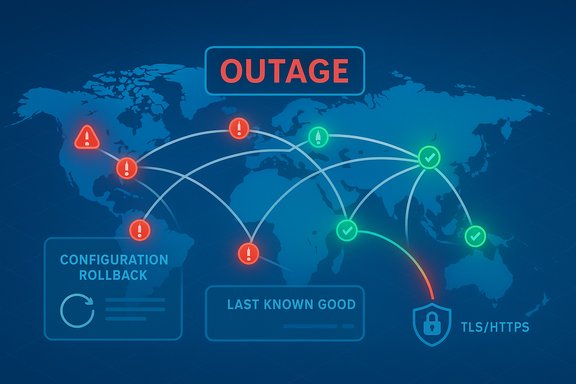
Global network outage map showing red error nodes and green validated paths with rollback options.Background / Overview​

Azure Front Door (AFD) is Microsoft’s globally distributed Layer‑7 edge and CDN‑style service that performs TLS termination, intelligent HTTP(S) routing, global load balancing, Web Application Firewall (WAF) enforcement and, in some configurations, DNS‑level steering for public endpoints. It is intentionally global, multi‑tenant and highly integrated with Microsoft Entra ID and Microsoft’s own SaaS control planes, which makes it both powerful and, in certain failure modes, a high‑blast‑radius surface. On October 29, telemetry and multiple public outage trackers showed a sharp spike in DNS failures, HTTP gateway errors (502/504), token issuance timeouts and management‑portal failures beginning in the afternoon UTC window. Microsoft’s public incident entries and status updates attributed the visible trigger to a configuration change that propagated into AFD’s control plane and caused routing/DNS anomalies across many Points‑of‑Presence (PoPs). Engineers responded by blocking further AFD changes, deploying a rollback to a validated configuration and rehoming traffic to healthy edge nodes while failing the Azure Portal away from the affected ingress paths to restore administrator access.

Timeline: what happened and when​

Detection and escalation​

  • ~16:00 UTC, October 29: Independent monitors and user reports began to spike with sign‑in failures, blank admin blades in Microsoft 365 and the Azure Portal, and widespread 502/504 gateway errors for sites fronted by Azure. Public outage trackers recorded tens of thousands of incident reports at peak.

Microsoft’s public acknowledgement and immediate mitigation​

  • Shortly after detection Microsoft posted an incident update identifying Azure Front Door as the locus of the problem and stated it had “confirmed that an inadvertent configuration change was the trigger event.” Microsoft immediately froze AFD configuration rollouts (including blocking customer changes), began to deploy a rollback to the “last known good” control‑plane configuration, and failed the Azure Portal away from affected AFD routes to restore administrative access.

Recovery and rollback​

  • Over the next several hours Microsoft completed the rollback and began recovering edge nodes while routing traffic through healthy PoPs. Status updates reported progressive signs of improvement and that AFD availability had climbed back above typical thresholds for the majority of customers; a residual “tail” of tenant‑specific symptoms persisted as DNS caches, CDN caches and ISP resolvers converged on corrected answers. Microsoft and independent monitors reported that most services returned to near pre‑incident performance within the evening-to‑overnight recovery window.
Note: precise user‑facing start and end times vary by region and by client DNS cache state; public outage counts (Downdetector and similar) are indicative rather than definitive. Several community and enterprise reconstructions corroborate the same high‑level timeline and the containment playbook used by engineering teams.

Technical anatomy — how a single configuration change amplified into a global outage​

Control‑plane vs data‑plane​

Azure Front Door separates the control plane (where routing, host mappings and rules are authored and published) from the data plane (the global edge nodes that actually route client traffic). When the control plane pushes a configuration update to thousands of PoPs, any invalid or incompatible state accepted by the control plane can cause a large number of edge nodes to serve incorrect DNS answers, drop or misroute traffic, or fail TLS/hostname validations. That behavior explains why a single configuration slip at the control‑plane layer can produce symptoms identical to a catastrophic backend failure even when origin servers remain healthy.

What Microsoft described publicly​

Microsoft’s public incident messages called out an “inadvertent configuration change” as the proximate trigger. Engineering mitigations were textbook for a global control‑plane incident: freeze configuration rollouts to prevent further propagation, roll back to a previously validated configuration, and rehome traffic away from affected nodes while recovering/bringing healthy nodes back online. The need to “fail the Azure Portal away from AFD” is telling: the portal itself often sits behind the same edge fabric, and losing the management plane complicates triage — a standard but painful constraint in large cloud incidents.

DNS, caching and convergence extend the pain​

Even after a successful rollback, the internet’s distributed nature — client DNS caches, ISP resolver caches, CDN TTLs and regional routing convergence — creates a residual tail of failures for users. For many tenants the outage ended only when DNS TTLs expired and caches cleared. This convergence tail is an operational reality that lengthens perceived downtime even when the provider’s control plane is corrected.

Why identity and management planes elevate blast radius​

AFD commonly fronts identity token issuance (Microsoft Entra ID / Azure AD) endpoints and management consoles. If the edge fabric interrupts or misroutes token‑exchange flows, sign‑ins fail across Microsoft 365 apps, Xbox authentication and tenant admin consoles simultaneously — multiplying business impact far beyond a single website outage. That coupling between identity and global ingress is a key reason the failure was so visible and disruptive.

Services and sectors affected — the visible impact​

The outage produced a broad consumer and enterprise blast radius because so many first‑party Microsoft control planes and third‑party customer sites use Azure Front Door as their global ingress.
  • Microsoft first‑party services: Microsoft 365 (Outlook on the web, Teams, admin blades), Azure Portal and Microsoft Entra token endpoints; Copilot integrations showed degraded behavior while authentication flows were impacted.
  • Gaming and consumer: Xbox Live sign‑ins, Microsoft Store purchases and Minecraft multiplayer/Realms authentication experienced interruptions; some console users needed device restarts once services returned.
  • Retail and hospitality: Mobile ordering and account features for major chains (reports included Starbucks and Costco) showed failures tied to Azure‑fronted endpoints.
  • Travel and public services: Alaska Airlines and Air New Zealand reported check‑in, payment or boarding‑pass processing problems; some government websites in New Zealand were also unreachable during the event. Airlines had to revert to manual processes at some airports.
  • Enterprise platform services: Azure App Service, Azure SQL and other platform services showed downstream issues for tenants whose public ingress used AFD. Community reporting and enterprise threads documented tenant‑specific residual problems during the recovery tail.
Across public trackers, reported incident spikes ranged in the tens of thousands of user reports at peak; these numbers provide scale but are not a substitute for Microsoft’s internal telemetry. Specific corporate impacts and the financial cost of manual workarounds remain organization‑by‑organization and will require customer disclosures for precise accounting.

What this outage exposes: systemic risks and architectural tradeoffs​

Concentration risk at hyperscale​

Hyperscalers deliver unmatched scale and features — but they also concentrate systemic risk. When a single global ingress fabric supports both first‑party control planes and a large catalogue of tenant front ends, a control‑plane slip can cascade across multiple industries and public services. This outage followed closely on another major cloud provider incident earlier in the same month, renewing scrutiny about dependency concentration among a handful of providers.

Control‑plane governance and rollout practices​

An “inadvertent configuration change” that can propagate widely suggests weaknesses in deployment gating, validation tests, canary isolation, or automation safeguards. Robust staging, stricter validation gates and limited blast‑radius canary patterns are essential when a control plane can update thousands of PoPs in minutes. Microsoft’s rollback and freeze actions were appropriate, but the event will likely accelerate pressure on cloud vendors to publish more granular post‑incident analyses and to harden their change pipelines.

Operational maturity for customers​

Many enterprise outages are not purely vendor failures — they are also the result of architectural choices that leave critical customer touchpoints reliant on a single vendor control plane. Airlines and retailers learned this at the counter: when check‑in and boarding pass issuance are routeable only through a vendor’s global edge, manual fallbacks become operationally costly. Designing intentional, tested fallbacks for identity, payments and booking flows is now a board‑level resilience concern.

Practical guidance for Windows administrators and IT teams​

Windows administrators and cloud architects must translate this incident into measurable, testable improvements for their environments. The following pragmatic checklist focuses on high‑impact, low‑friction measures:
  • Map critical dependencies
  • Inventory every user journey that depends on external ingress or identity: admin portals, single sign‑on (SSO), payment APIs and customer check‑in flows.
  • Identify which of those journeys are fronted by Azure Front Door or other single‑provider ingress.
  • Harden identity fallbacks
  • Where possible, implement secondary authentication paths that don’t require the primary edge fabric (for example, alternate endpoints or temporary token issuers).
  • Test the ability to authenticate and issue time‑limited credentials if the primary token‑exchange path is degraded.
  • Review DNS TTLs and cache‑sensitive designs
  • Avoid excessively long DNS TTLs for critical endpoints that might require rapid failover.
  • Test failover scenarios across multiple resolvers and geographic regions, and document convergence time expectations.
  • Maintain out‑of‑band administrative access
  • Ensure management plane access and emergency tooling are available if the portal is affected — e.g., alternate CLI paths, automation runbooks with separate network paths, or secondary admin accounts reachable via an alternate provider.
  • Canary and rehearse vendor outage playbooks
  • Run tabletop and live drills that simulate vendor control‑plane loss and measure human and system response times.
  • Require vendor SLAs and contract terms that include incident notification specifics and remediation commitments for control‑plane and edge outages.
  • Consider multi‑path architectures for critical services
  • For business‑critical payment, booking and identity services, evaluate multi‑cloud or vendor‑agnostic fallbacks for ingress and authentication. This is not a wholesale rejection of cloud, but a targeted partitioning of critical paths to reduce single‑point systemic risk.

Vendor responsibilities and what to watch for in Microsoft’s post‑incident material​

Microsoft’s immediate public messaging identified the proximate trigger and described the containment steps. But deeper transparency is essential for customers to quantify residual risk and validate vendor remediation:
  • A credible post‑incident report should include the exact configuration change that triggered the failure, the validation/deployment pipeline state that allowed it to pass, and the remedial changes implemented to prevent recurrence.
  • Customers will want evidence of improved gating, automated rollback tests, canary isolation windows and stricter access controls for control‑plane changes.
  • Because DNS and cache convergence drove a long recovery tail for some tenants, Microsoft should publish precise timelines for when cache states were corrected and which regions/PoPs were most affected.
Until that post‑mortem exists, organizations should treat any deep causal claims above the acknowledged configuration change as provisional and base contractual or remediation decisions on documented, verifiable vendor commitments.

Market and regulatory implications​

This incident arrives in an environment where hyperscaler outages draw immediate regulatory and competitive scrutiny. Policymakers and large enterprise customers are increasingly sensitive to concentration risks in cloud infrastructure, and repeated incidents at the top providers raise questions about whether additional operational guardrails, auditability or even policy interventions will be required.
For enterprises, this means:
  • Expect procurement teams to demand clearer operational playbooks, demonstrable testing of control‑plane safety nets, and stronger contractual remedies for systemic failures.
  • Boards and risk committees are likely to re‑examine cloud vendor concentration across critical functions and require quantified resilience plans, including costed multi‑path strategies for top‑priority services.

Strengths, weaknesses and a measured verdict​

Notable strengths​

  • Microsoft’s rapid acknowledgement and concerted rollback strategy are consistent with modern, experienced incident response: freeze the faulty change, revert to validated state, and recover nodes while failing management traffic away from the affected fabric. Customers saw progressive recovery within hours, which indicates operational competence under pressure.
  • Azure Front Door provides significant performance, security and manageability benefits under normal conditions; its global edge fabric is a major reason many enterprises choose Azure for performance and global reach. Microsoft’s documentation shows a mature feature set (TLS termination, WAF, global load balancing).

Significant weaknesses and risks​

  • The incident highlights control‑plane fragility for global edge fabrics: a single misapplied configuration can affect identity and admin planes simultaneously, producing an outsized outage even when origin backends are healthy.
  • Lack of public post‑incident detail so far leaves customers uncertain about the depth of the root cause and whether systemic tooling or process changes are complete. Until Microsoft publishes a detailed post‑incident review, customers must assume residual risk.
Measured verdict: Microsoft’s response limited the outage window and restored services for most customers within hours, but the event is an important operational warning. The availability of strong edge services is no substitute for explicit architectural partitions and tested fallbacks for mission‑critical user journeys.

Conclusion​

The October 29 Azure outage was not just another downtime headline; it underlined a structural truth about modern cloud infrastructure: the edge and control plane are now as critical as compute and storage, and they demand the same discipline in validation, canarying and governance. Microsoft’s rollback and recovery reduced the disruption, but the incident leaves enterprises and Windows administrators with a practical mandate — map the dependencies that matter, rehearse portal‑loss and token‑exchange failures, and insist on both contractual and technical safeguards for the control‑plane surfaces that now carry so much operational weight. The cloud’s convenience and scale are real, but so is the need to engineer resilience deliberately around the edge.
(Note: The technical description above draws on Microsoft’s public AFD documentation and multiple independent news and monitoring reports; counts from public outage trackers vary by aggregator and are indicative rather than precise. Readers should treat per‑company impact tallies as provisional until individual organizations publish their own post‑incident statements.
Source: Anchorage Daily News Microsoft deploys a fix to Azure cloud service hit with global outage
 

Back
Top