

Microsoft documents WPR as an Event Tracing for Windows collector and WPA as its analysis companion. Its Windows Performance Toolkit documentation describes separate built-in profiles for CPU and disk I/O, while a Microsoft support troubleshooting guide maps those recordings to WPA’s CPU and process views. That division is important: Task Manager tells you what is busy now; a trace preserves what happened immediately before, during, and after the slowdown.
A short trace is the right first move for a sluggish app launch, stuttering Explorer window, periodic freeze, or unexplained disk storm. It is not a substitute for a boot trace. If the complaint is “Windows takes five minutes to settle after I sign in,” capture a separate On/Off Boot recording rather than trying to infer startup behavior from a trace started after the desktop appears.
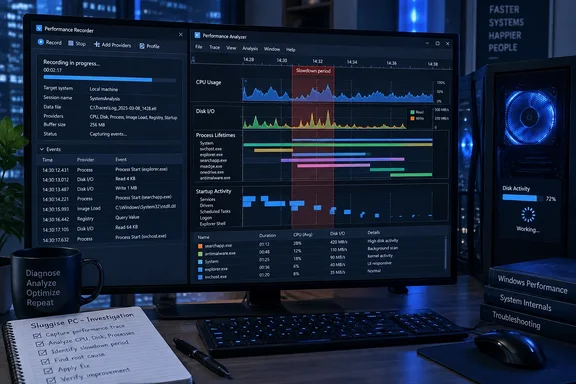 Install the Windows Performance Toolkit, not the whole deployment stack
Install the Windows Assessment and Deployment Kit and select Windows Performance Toolkit in the feature list. You do not need Windows PE, deployment utilities, or the full assessment catalog merely to diagnose a slow workstation.
Microsoft’s current ADK guidance recommends matching the ADK as closely as practical to the Windows version being examined. In a mixed Windows environment, use a toolkit version appropriate for the newest supported client you administer. The ADK package is also where the graphical Windows Performance Recorder and Windows Performance Analyzer applications are installed.
There is a minor source of confusion here. Windows includes a command-line WPR component on modern Windows versions, but the graphical WPR interface and WPA analysis application are delivered through the Windows Performance Toolkit. For this guide, use the graphical tools; they make it far harder to accidentally capture an overly broad, long-running trace.
Before collecting anything, create a local folder such as C:\Traces. Leave ample free disk space and avoid saving the trace onto a removable drive or a network share while investigating storage performance. An ETL trace can contain process names, executable paths, loaded modules, file paths, and occasionally command-line details. Treat it as diagnostic data, not as something to attach casually to a public support thread.
Capture the slowdown, not an hour of normal use
Open Windows Performance Recorder as an administrator. In the main window, select the General performance scenario. The default first-level triage recording already captures a useful baseline of scheduling, CPU sampling, disk I/O, hard faults, process and thread activity, interrupts, DPCs, and power-related events.
Then open the additional-profile options and select:
- CPU Usage when the computer becomes unresponsive, an application pegs a core, audio or video stutters, or a process repeatedly spikes in Task Manager.
- Disk I/O Activity when the drive LED is persistently active, File Explorer hangs, applications pause while opening or saving files, or the system reports high disk activity.
- File I/O Activity only when you need to know which files are being read or written; it can produce a more revealing but more sensitive and larger trace.
Do not enable every available profile merely because you can. A targeted trace is easier to analyze, creates less overhead, and limits the chance of drowning the event in unrelated telemetry. CPU Usage plus Disk I/O Activity is the best starting pair for most intermittent desktop slowdowns. Add File I/O only after the first trace says the bottleneck is genuinely storage-related but does not identify the files or workload involved.
Click Start, then reproduce one specific problem. Launch the app that drags, open the folder that hangs, run the action that makes the PC pause, or wait through the recurring slowdown. Keep the reproduction short—typically 30 seconds to two minutes—and avoid changing variables while recording. Do not start disabling services, launching cleanup tools, or opening ten monitoring applications midway through the run. Every extra action becomes another competing workload in the trace.
When the slowdown has happened, click Save or Stop in WPR, choose a descriptive filename, and include what you were doing in the problem description if prompted. Names such as 2026-09-20-ExplorerHang.etl or 2026-09-20-TeamsLaunchSlow.etl are much more useful than trace1.etl when comparing captures later.
A trace that never contains the actual bad interval is not evidence that the PC is healthy. It is simply a recording of normal behavior. If the issue is intermittent, repeat the capture until you have both a “bad” trace and, ideally, a baseline trace from the same action when it behaves normally.
Use WPA’s timeline before sorting any table
Open the ETL file in Windows Performance Analyzer. The first load can take time, particularly for recordings with disk or file activity. WPA initially presents a Graph Explorer pane and an analysis workspace; drag the views you need into the workspace rather than trying to interpret every graph at once.
Start with a simple question: when, exactly, did the PC feel slow? Find the spike, plateau, or repeating burst in a timeline graph and drag across that interval to select it. Then zoom to the selection. WPA calculates its tables against the selected time range, so analysis without a precise time selection often identifies the busiest program over the entire recording rather than the process responsible for the pause.
For CPU cases, add Computation > CPU Usage (Sampled). Set the table’s grouping so that Process Name appears first, then Thread ID or Stack when necessary. Sort the CPU usage metric descending.
A process at the top of the table is an observation, not a diagnosis. MsMpEng.exe, SearchIndexer.exe, a browser process, a backup agent, or a game launcher might be consuming CPU because it is the cause of the slowdown—or because another process has triggered a legitimate scan, indexing task, update, or synchronization operation. Select the time range first, then inspect whether its activity coincides with the moment input, app launching, or Explorer responsiveness became poor.
If one process is consistently dominant, expand it to the thread level. A single busy thread can explain why one application is stalled even when total CPU usage looks modest on a machine with many cores. If symbols are available, WPA can resolve sampled call stacks and show which code path was running. Without symbols, process and thread attribution is still valuable; do not let missing symbols prevent you from determining whether the pressure belongs to Windows, a driver host, a security product, or a third-party application.
Read disk activity as latency and ownership, not just megabytes
For suspected storage stalls, add the Disk Usage view from WPA’s Storage category. Look for the same selected interval used in CPU analysis and group the table first by Process Name. Depending on the graph and configured columns, useful fields include I/O count, read or write bytes, service time, and file name or path.
High throughput is not automatically a problem. Copying a large video file can produce substantial disk traffic while leaving the desktop usable. The more suspicious pattern is prolonged service time, a large number of small I/O operations, or a process issuing disk requests continuously during the exact period applications stop responding.
Watch for three common patterns:
- A single process dominates both CPU and disk activity, which usually points toward an application workload, content scan, update, archive operation, sync client, or backup task.
- Disk service time rises while the most visible application is quiet, which can indicate another process, a filter driver, a paging workload, or a storage subsystem issue that needs deeper investigation.
- CPU spikes and disk reads alternate, which often means a process is repeatedly parsing, scanning, compiling, indexing, or loading data rather than simply transferring a large file.
File I/O traces can take the analysis further by exposing the files involved. That can distinguish, for example, a browser cache churn from a cloud-sync folder, an antivirus scan of a large archive, or a process repeatedly opening a damaged local database. But do not mistake a frequently accessed file for proof that it is corrupt. The trace shows what happened and when; it does not establish the underlying defect without corroborating errors, application logs, SMART data, or reproducible behavior.
Separate startup diagnosis from normal desktop tracing
Background processes and startup applications can affect a PC long after sign-in, but a normal General recording only sees what occurs after you press Start. It cannot reconstruct the driver initialization, logon, Run/RunOnce activity, service startup, or early desktop work that already occurred.
For a startup-specific complaint, open WPR and choose On/Off – Boot as the performance scenario. Microsoft’s WPR documentation identifies this as the scenario for recording while the computer boots; unlike a normal memory-mode recording, On/Off transition traces are written to disk. Save unsaved work, start the boot recording, and allow the required reboot to occur without interacting with the machine more than necessary.
After the system returns to the desktop and the recording is saved, open the resulting ETL in WPA. Focus on the interval after the desktop becomes visible as well as the earlier boot phases. Microsoft’s startup guidance specifically notes that desktop applications in the boot path affect startup and shutdown experience; a visibly slow system after sign-in may be delayed by shell initialization, a startup app, a service, a driver, or storage activity that continues after the user sees the desktop.
Use process lifetimes alongside CPU and disk graphs. A process that starts at logon, consumes CPU or I/O during the bad interval, and then exits or goes idle is a stronger lead than an application that merely happens to be running. For startup entries, confirm the launch source before changing anything: Run keys, Startup folders, scheduled tasks, services, and vendor update agents have different ownership and remediation paths.
Turn the trace into a safe next action
The trace should narrow your next step, not tempt you into deleting startup entries or disabling Windows services at random. If a third-party updater, sync client, backup job, or browser extension owns the selected CPU or disk interval, test its configuration, update it, schedule it outside working hours, or uninstall it if it is no longer needed. If a security product dominates the interval, inspect its scan schedule and exclusions policy before weakening protection.
If the workload is owned by Windows components, preserve the ETL and compare it with a known-good trace after the behavior ends. For storage-heavy cases, check Windows Event Viewer for disk, NTFS, controller, or reset errors and verify drive health using the hardware vendor’s diagnostic tools. A trace that shows long storage delays but no single process ownership is a reason to investigate the disk, controller driver, firmware, filter drivers, and paging pressure—not a reason to blame the application that happened to be waiting.
The practical payoff is a record tied to time: this process, on this thread, issued this CPU or I/O workload during the seconds the machine became unusable. Once you have that, performance troubleshooting stops being a sequence of generic cleanup rituals and becomes a specific change you can test, reverse, and verify with a second trace.