
The feature is already released, despite the original HWCooling report describing it as an upcoming capability. HWiNFO’s own version history lists build 6045 as the pre-release that added GPU hotspot reporting for NVIDIA Blackwell, per-chip VRAM monitoring for NVIDIA GPUs with GDDR6X or GDDR7, and per-chip VRAM monitoring for AMD Navi GPUs.
That official changelog also draws a sharper compatibility line than some early coverage. HWiNFO specifically names GDDR6X and GDDR7 for NVIDIA, not every GeForce card with GDDR6. AMD support is described as applying to Navi GPUs, a designation spanning the RDNA-era Radeon family beginning with the Radeon RX 5000 series. Owners should therefore treat the sensor list HWiNFO actually presents on their card—not a broad architecture label—as the definitive answer on whether their individual modules are readable.
 A maximum temperature is no longer the whole story
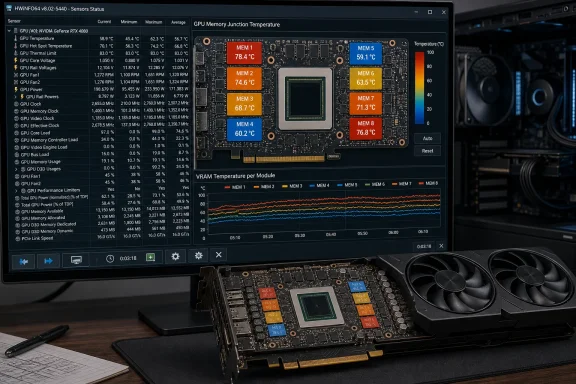
For years, GPU utilities have generally exposed a single VRAM temperature, variously labeled Memory Junction, Memory Temperature, or something similar. That figure is useful as an alarm, but it is a poor diagnostic tool: it cannot show whether all chips are running at roughly the same temperature or whether one package has poor contact with a thermal pad while the others are healthy.
VideoCardz, reporting on the work by Brazilian GPU repair technicians and independent developers, said the pre-existing single NVIDIA memory reading represented the hottest available sensor rather than an average. In one reported GeForce RTX 3080 test, one channel reached 86°C while the remaining readings were lower. That is the practical significance of HWiNFO’s change: an 86°C peak is one thing if every chip is near it; it is another if a single module is tens of degrees above its neighbors.
The distinction matters most for cards that have already developed a symptom. A system may display graphical corruption, intermittent game crashes, driver resets, or stability problems during memory-heavy workloads while the headline GPU-core temperature looks normal. A lone hot memory module does not prove the memory chip itself has failed, but it gives a technician a place to investigate: pad placement, pad thickness, cooler mounting pressure, contamination, an uneven cold plate, or damage concentrated near one physical area of the PCB.
It also changes how enthusiasts should interpret “acceptable” VRAM temperatures. A card operating below its firmware thermal limit does not necessarily have a uniform thermal profile. Conversely, a modest spread between packages is not evidence of a defect. The useful signal is a repeatable outlier under a comparable sustained load, particularly one that correlates with instability, throttling, or an abrupt change after a cooler repaste or disassembly.
The NVIDIA data is available, but not through NVIDIA’s public tooling
The route to these measurements is as notable as the measurements themselves. VideoCardz and the MSI Afterburner developer known as Unwinder have described the relevant NVIDIA interfaces as private or reverse-engineered rather than documented public telemetry APIs. HWiNFO developer Martin Malík was among the developers involved in implementing support.
NVIDIA’s consumer software has historically exposed far less thermal detail than the hardware appears capable of reporting. The same recent research restored GPU-hotspot readings on GeForce RTX 5000-series cards, then uncovered per-module memory information for GDDR6X and GDDR7 hardware. The data is not a new sensor installed by HWiNFO; it is telemetry that was already present in the cards and is now being interpreted by third-party software.
That creates one operational limitation for anyone relying on the readings in a support workflow: this is not a vendor-documented interface with a published long-term compatibility commitment. HWiNFO’s implementation is real and available in the beta, but NVIDIA has not publicly committed to preserving third-party access to these low-level readings through future driver or firmware changes.
For now, the better conclusion is more modest. The telemetry appears sufficiently mature for HWiNFO to ship it in a public pre-release, and the values have been demonstrated across more than one GPU generation. But users should avoid building automated production monitoring or warranty decisions around a sensor path NVIDIA has not formally documented.
“Per-chip” does not always mean one value for every physical package
The new labels should also be read carefully on high-end cards with clamshell memory layouts, where memory packages are fitted on both sides of the PCB. VideoCardz reports that a GeForce RTX 5090 has 16 GDDR7 packages but exposes eight measurement points, with each reading covering a paired group rather than a uniquely identified physical package.
That is a material qualification to the “individual memory chip” headline. HWiNFO is providing much finer granularity than a single junction temperature, but a GeForce RTX 5090 owner cannot necessarily point to “Memory Chip #6” and know which of the 16 physical packages is responsible without mapping the board layout and understanding how NVIDIA pairs the sensors.
Tom’s Hardware likewise reported successful HWiNFO monitoring across the RTX 5090’s GDDR7 implementation, but its article identified the beta as v8.51-6304. HWiNFO’s primary version-history record instead identifies the released pre-release containing the feature as v8.51-6045. The official HWiNFO record is the one to use when obtaining the build; the 6304 identifier in the secondary report does not match the vendor’s published version history.
This grouping issue does not make the feature less useful. If one paired reading is consistently much hotter than the others, it still identifies a problem area that the old single maximum value concealed. It does mean that disassembling a card on the basis of one number alone remains premature—especially since opening many board-partner cards can complicate a warranty claim, depending on the seller and jurisdiction.
Radeon support may be the more straightforward win
AMD’s side is potentially cleaner because HWiNFO’s change log applies the feature broadly to “AMD Navi GPUs,” rather than tying it to a specific memory generation. That encompasses RDNA, RDNA 2, RDNA 3, and RDNA 4 products: in retail terms, Radeon RX 5000, RX 6000, RX 7000, and RX 9000 series hardware.
HWiNFO already had access to a high-level Radeon memory temperature on supported cards. Malík previously explained on the HWiNFO forum that the Navi memory value was a junction-temperature reading from the memory sensor, rather than a package-surface measurement. The new reporting adds the missing distribution: users can now see whether the high-level number is driven by all modules or by a small subset.
That is especially useful for recent Radeon cards with large coolers and multiple memory packages arranged around the GPU die. A conventional core-temperature result can be reassuring while memory cooling is uneven, because the core and memory travel heat through different contact points, pads, plates, and sections of the heatsink. Per-package telemetry cannot identify the root cause by itself, but it can distinguish a broadly undersized cooler from a localized contact problem.
The feature may also reduce unnecessary card teardowns. An owner who sees a high-but-uniform set of memory temperatures under a heavy workload has a different situation from an owner who sees one package substantially detached from the rest of the thermal profile. The former may be dealing with fan curves, ambient temperature, workload, or a cooler designed around the card’s stated thermal envelope. The latter has stronger evidence for an assembly or material issue.
How to use the new readings without chasing noise
HWiNFO’s beta is a diagnostic tool, not a reason to start replacing thermal pads on a working GPU. The first useful test is controlled: run a repeatable, memory-intensive workload for long enough to stabilize temperatures, then compare the maximum values across modules. Use the same fan profile, case configuration, room temperature, and power limit when comparing results before and after a driver update, undervolt, or cooler adjustment.
A practical triage sequence is short:
- Record the GPU temperature, hotspot temperature, memory readings, fan speed, board power, and clock behavior during a sustained load rather than relying on an idle screenshot.
- Look for a stable temperature outlier across repeated runs, not a one-second polling spike.
- Compare the delta between memory channels before comparing any one value against online screenshots from a different card model, case, room temperature, BIOS, or workload.
- Investigate the cooler only when the thermal pattern accompanies a real symptom—throttling, crashes, artifacts, unusually high fan behavior, or a marked change from the card’s own previous baseline.
The immediate consequence is that an important blind spot in Windows GPU diagnostics has narrowed. HWiNFO v8.51-6045 Beta gives supported GeForce and Radeon owners a way to see the thermal imbalance behind a maximum VRAM temperature—while leaving NVIDIA’s long-term support for the reverse-engineered sensor access unresolved.