
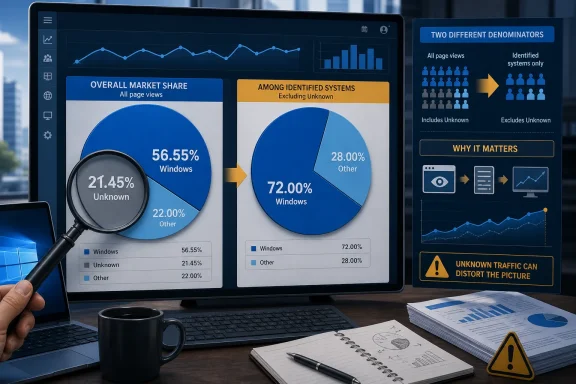
The viral claim that Windows “lost” 15 to 22 percentage points of desktop market share in a matter of weeks rests on a real StatCounter number, but it was widely interpreted as a count of PCs abandoning Windows. It is not that. StatCounter’s June 2026 worldwide desktop table placed Windows at 56.55% and Unknown at 21.45%; the latter is too large to treat as a footnote when explaining the former.
MakeUseOf correctly identifies the conspicuous Unknown category as the missing context behind the screenshot campaign. But the more important correction is sharper: Windows at 56.55% and Windows at roughly 72% are not competing revisions of the same measurement. They use different denominators. One includes all desktop page views StatCounter could not classify by operating system; the other excludes them.
That distinction means there is no evidence of a sudden Windows migration on the scale implied by the original chart. It also means there is not yet public evidence that StatCounter has identified, admitted, and fixed a specific June data-processing error.
The June figures reported across early coverage were Windows at 56.55% or 56.61%, depending on rounding, and Unknown at 21.45%. Remove Unknown from the denominator and the calculation becomes straightforward:
Korben first highlighted the difference between the visible table and StatCounter’s downloadable data presentation, and Windows Latest subsequently described the higher result as a correction. The problem is that StatCounter’s own documentation does not establish that 72% is a revised June estimate, or that it has replaced the 56.55% full-table figure. Its FAQ explicitly says its figures are subject to quality assurance and revision for 45 days after publication, and that substantive changes are flagged on graphs.
As of August 4, that 45-day period for June has not clearly passed. StatCounter has not published a June 2026 incident note identifying a bad bot filter, a broken user-agent rule, an AI crawler issue, or a reclassification of Windows traffic. The claim that the company “caught the error” has spread largely through follow-on coverage, but a vendor acknowledgement explaining what failed is missing from the public record.
That is a material difference for anyone using these figures in an IT planning deck or a Windows-versus-Linux adoption argument. A calculated known-OS share can be useful. It should not be presented as a vendor-certified correction unless StatCounter says it is one.
Each recorded visit is classified from browser and operating-system information available to StatCounter. That makes its desktop OS chart a measure of observed web traffic in its network. It does not make it a direct census of the installed desktop base.
The Unknown line is therefore not a product category alongside Windows, macOS, Linux, and ChromeOS. It is unresolved traffic. The data does not publicly reveal how much of that 21.45% came from Windows machines, Apple hardware, Linux systems, enterprise security tools, browsers limiting exposed platform information, custom clients, automation, or traffic that StatCounter could not reliably classify for another reason.
This is where some coverage has moved beyond what the evidence supports. MakeUseOf suggests that bots, scrapers, privacy tools, altered user-agent strings, and AI crawlers could feed the category. Those are plausible mechanisms in a browser-based measurement system, but StatCounter has not publicly attributed June’s Unknown increase to any of them. In fact, StatCounter says it removes bot activity and monitors for data-quality issues. A sudden Unknown spike may indicate an identification problem, but it does not prove that bots slipped through or that a particular crawler caused it.
StatCounter’s methodology also makes the phrase “market share” deceptively broad. The company intentionally counts page views rather than unique visitors and does not apply artificial country weighting. A high-volume class of traffic can therefore move a worldwide percentage without representing an equivalent movement in the population of PCs.
For ordinary month-to-month trend watching, that methodology can still be valuable. For a one-month discontinuity involving more than one fifth of the reported desktop traffic, the unresolved category becomes part of the headline.
Neither has been publicly supplied.
The scale of the apparent decline should have prompted that check immediately. Windows’ share in the StatCounter table was reported around 79% in April 2026, then around 56.55% in June. Linux increased, but only to roughly 4.4%; the combined macOS and older OS X entries were also nowhere near large enough to account for the apparent disappearance of more than one fifth of desktop traffic.
Meanwhile, Unknown reached 21.45%. That does not prove all—or even most—of Unknown was Windows. But it does show why assigning the whole difference to Linux, macOS, or a mass Windows exodus was analytically indefensible.
The timing also matters. StatCounter’s public chart figures are provisional for 45 days. Treating June’s initial table as a stable historical record before that review window ended was an avoidable reporting error by the outlets and social accounts that declared a permanent milestone.
A more accurate wording would have been: “StatCounter’s preliminary June table shows Windows at 56.55% of all measured desktop traffic, while 21.45% is unclassified.” That is less dramatic than “Windows has fallen below 60%,” but it is the figure the data can actually support.
But StatCounter’s June result cannot quantify a durable shift with the precision many headlines claimed.
The category baseline itself makes comparisons complicated. StatCounter’s desktop table has carried a substantial Unknown share before June, so subtracting Unknown is not a neutral cleanup step; it changes the question being answered. A Windows figure calculated from classified traffic should be compared with prior classified-traffic figures, not casually compared with an all-traffic Windows percentage from a different chart or download format.
That is also why the April-to-June “22-point crash” needs careful handling. One figure may reflect Windows as a share of all reported traffic while another may be cited from a known-OS presentation. Compare unlike denominators and a routine change can become a manufactured cliff.
For Windows administrators, this is more than media literacy. Public market-share charts are often used to justify application support, browser testing, endpoint-management priorities, and security assumptions. A figure based on page views across an opaque third-party website sample should not outweigh direct telemetry from an organization’s own endpoint platform, Microsoft Intune inventory, Configuration Manager, Entra device records, help-desk data, or application logs.
Until then, the defensible conclusion is narrower than either side of the online argument. Windows did not demonstrably lose 15 or 22 points of installed-PC share overnight, because StatCounter does not measure installed PCs and because a 21.45% Unknown bucket prevents that inference. But the roughly 72% number circulating as the “real” June Windows share is also not proof that StatCounter repaired a bad 56.55% result; it is Windows’ calculated share after excluding the traffic StatCounter could not identify.
The practical lesson is to preserve the denominator with the number. If a market-share chart suddenly produces a historic cliff while an unclassified category rises by nearly the same amount, the chart is reporting uncertainty as much as competition.
That distinction means there is no evidence of a sudden Windows migration on the scale implied by the original chart. It also means there is not yet public evidence that StatCounter has identified, admitted, and fixed a specific June data-processing error.
 The 72% figure is arithmetic, not a demonstrated repair
The June figures reported across early coverage were Windows at 56.55% or 56.61%, depending on rounding, and Unknown at 21.45%. Remove Unknown from the denominator and the calculation becomes straightforward:- Identified desktop operating-system traffic equals 78.55% of the reported total.
- Windows’ 56.55% divided by that 78.55% equals approximately 72.0%.
Korben first highlighted the difference between the visible table and StatCounter’s downloadable data presentation, and Windows Latest subsequently described the higher result as a correction. The problem is that StatCounter’s own documentation does not establish that 72% is a revised June estimate, or that it has replaced the 56.55% full-table figure. Its FAQ explicitly says its figures are subject to quality assurance and revision for 45 days after publication, and that substantive changes are flagged on graphs.
As of August 4, that 45-day period for June has not clearly passed. StatCounter has not published a June 2026 incident note identifying a bad bot filter, a broken user-agent rule, an AI crawler issue, or a reclassification of Windows traffic. The claim that the company “caught the error” has spread largely through follow-on coverage, but a vendor acknowledgement explaining what failed is missing from the public record.
That is a material difference for anyone using these figures in an IT planning deck or a Windows-versus-Linux adoption argument. A calculated known-OS share can be useful. It should not be presented as a vendor-certified correction unless StatCounter says it is one.
Unknown is a classification result, not a new desktop platform
StatCounter says Global Stats are derived from more than 3 billion page views per month across more than 1 million websites using its analytics code. It measures web activity, not shipped PCs, Windows licenses, enterprise endpoints, active Microsoft accounts, or unique individual users.Each recorded visit is classified from browser and operating-system information available to StatCounter. That makes its desktop OS chart a measure of observed web traffic in its network. It does not make it a direct census of the installed desktop base.
The Unknown line is therefore not a product category alongside Windows, macOS, Linux, and ChromeOS. It is unresolved traffic. The data does not publicly reveal how much of that 21.45% came from Windows machines, Apple hardware, Linux systems, enterprise security tools, browsers limiting exposed platform information, custom clients, automation, or traffic that StatCounter could not reliably classify for another reason.
This is where some coverage has moved beyond what the evidence supports. MakeUseOf suggests that bots, scrapers, privacy tools, altered user-agent strings, and AI crawlers could feed the category. Those are plausible mechanisms in a browser-based measurement system, but StatCounter has not publicly attributed June’s Unknown increase to any of them. In fact, StatCounter says it removes bot activity and monitors for data-quality issues. A sudden Unknown spike may indicate an identification problem, but it does not prove that bots slipped through or that a particular crawler caused it.
StatCounter’s methodology also makes the phrase “market share” deceptively broad. The company intentionally counts page views rather than unique visitors and does not apply artificial country weighting. A high-volume class of traffic can therefore move a worldwide percentage without representing an equivalent movement in the population of PCs.
For ordinary month-to-month trend watching, that methodology can still be valuable. For a one-month discontinuity involving more than one fifth of the reported desktop traffic, the unresolved category becomes part of the headline.
The first screenshots mixed two different claims
The original viral interpretation collapsed two separate statements into one:- Windows represented about 56.55% of all desktop page views in StatCounter’s June table.
- Windows users had abandoned the operating system at a historic rate.
Neither has been publicly supplied.
The scale of the apparent decline should have prompted that check immediately. Windows’ share in the StatCounter table was reported around 79% in April 2026, then around 56.55% in June. Linux increased, but only to roughly 4.4%; the combined macOS and older OS X entries were also nowhere near large enough to account for the apparent disappearance of more than one fifth of desktop traffic.
Meanwhile, Unknown reached 21.45%. That does not prove all—or even most—of Unknown was Windows. But it does show why assigning the whole difference to Linux, macOS, or a mass Windows exodus was analytically indefensible.
The timing also matters. StatCounter’s public chart figures are provisional for 45 days. Treating June’s initial table as a stable historical record before that review window ended was an avoidable reporting error by the outlets and social accounts that declared a permanent milestone.
A more accurate wording would have been: “StatCounter’s preliminary June table shows Windows at 56.55% of all measured desktop traffic, while 21.45% is unclassified.” That is less dramatic than “Windows has fallen below 60%,” but it is the figure the data can actually support.
Windows may still be losing share, but June cannot measure the size of it
The 72% known-OS calculation does not absolve Windows of every long-term competitive concern. If Windows’ share among identified desktop traffic has declined over a year while macOS and Linux have gained, that is a trend worth tracking. Windows 10’s end of support in October 2025, Windows 11 hardware requirements, dissatisfaction with Microsoft’s product direction, and the expansion of capable Linux gaming and productivity options all give users reasons to reconsider their next PC or operating-system choice.But StatCounter’s June result cannot quantify a durable shift with the precision many headlines claimed.
The category baseline itself makes comparisons complicated. StatCounter’s desktop table has carried a substantial Unknown share before June, so subtracting Unknown is not a neutral cleanup step; it changes the question being answered. A Windows figure calculated from classified traffic should be compared with prior classified-traffic figures, not casually compared with an all-traffic Windows percentage from a different chart or download format.
That is also why the April-to-June “22-point crash” needs careful handling. One figure may reflect Windows as a share of all reported traffic while another may be cited from a known-OS presentation. Compare unlike denominators and a routine change can become a manufactured cliff.
For Windows administrators, this is more than media literacy. Public market-share charts are often used to justify application support, browser testing, endpoint-management priorities, and security assumptions. A figure based on page views across an opaque third-party website sample should not outweigh direct telemetry from an organization’s own endpoint platform, Microsoft Intune inventory, Configuration Manager, Entra device records, help-desk data, or application logs.
What to watch when StatCounter’s review period closes
StatCounter’s own published rules give the June data an important deadline: the figures remain open to revision for 45 days from publication. A credible resolution would be a visible chart annotation, revised historical values, or an explanation of the classification change and its scope.Until then, the defensible conclusion is narrower than either side of the online argument. Windows did not demonstrably lose 15 or 22 points of installed-PC share overnight, because StatCounter does not measure installed PCs and because a 21.45% Unknown bucket prevents that inference. But the roughly 72% number circulating as the “real” June Windows share is also not proof that StatCounter repaired a bad 56.55% result; it is Windows’ calculated share after excluding the traffic StatCounter could not identify.
The practical lesson is to preserve the denominator with the number. If a market-share chart suddenly produces a historic cliff while an unclassified category rises by nearly the same amount, the chart is reporting uncertainty as much as competition.
References
- Primary source: MakeUseOf
Published: 2026-08-04T12:00:12+00:00
Loading…
www.makeuseof.com - Related coverage: windowsforum.com
Loading…
windowsforum.com - Related coverage: siecledigital.fr
Loading…
siecledigital.fr - Related coverage: tech.yahoo.com
Has Windows Desktop Market Share Dropped Below 60%? Not Quite
After releasing data that put Windows desktop market share at 56% for June, Statcounter updates its dashboards with Microsoft's OS at 72%.tech.yahoo.com - Related coverage: hardwareluxx.de
Loading…
www.hardwareluxx.de - Related coverage: linuxstans.com
Windows Under 60% as Linux Hits a Yearly High: Full Breakdown
Windows just fell below 60% market share for the first time ever, the same month Linux hit a yearly high. Here’s the full breakdown.linuxstans.com - Related coverage: linux-magazin.de
Loading…
www.linux-magazin.de - Related coverage: chicagovps.net
Loading…
www.chicagovps.net - Related coverage: windowsreport.com
Loading…
windowsreport.com - Related coverage: moneycontrol.com
Loading…
www.moneycontrol.com - Related coverage: news.rambler.ru
Loading…
news.rambler.ru - Related coverage: cnews.ru
Loading…
www.cnews.ru - Related coverage: windowscentral.com
Windows 11's market share is now up to 73% in February 2026 | Windows Central
It seems that Windows 11's growth has finally hit a tipping point.www.windowscentral.com - Related coverage: korben.info
StatCounter can't identify 1 in 5 visits (and it's skewing everything) - Korben
Windows has allegedly dropped below the 60% market share threshold. That's what you'll find plastered all over the tech press this week. It comes from ...korben.info