
The practical value is less about watching another graph and more about exposing an expensive failure mode: an AI-enabled app can appear to be hardware-accelerated while portions of its model, or the entire inference job, run through a general-purpose CPU or standard GPU path. Until now, Task Manager could show that a process was busy, but it did not offer a straightforward per-process readout for the NPU or the GPU’s dedicated matrix hardware.
Microsoft has not published an exact Windows build number, servicing update, or complete hardware list for the new Task Manager columns. The company’s wording — “on some newer devices” — is an important limitation for IT departments planning validation or support scripts. Seeing an NPU listed in Task Manager’s Performance pane is not, by itself, evidence that a given PC has received the new per-process instrumentation.
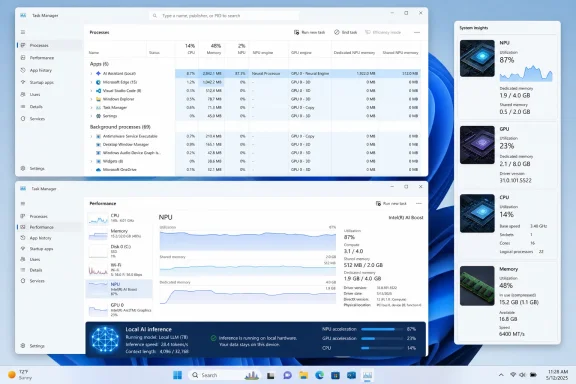 New columns turn AI acceleration into something support teams can inspect
On eligible machines, Task Manager’s Processes and Details tabs can expose columns for NPU, NPU engine, GPU, GPU engine, Dedicated NPU memory, and Shared NPU memory. The Performance tab continues the picture with aggregate utilization views for the NPU and GPU, including the GPU neural engine where the hardware and driver expose it.
For desktop support, this creates a quick first-pass check when a user says an AI feature is slow, noisy, or draining a battery. An admin can add the NPU, NPU engine, GPU, and GPU engine columns, identify the application or background agent, then observe whether its work is landing on an NPU or on a GPU neural engine.
The workflow also makes it easier to separate several different problems that users may describe identically as “AI is slow.” A process showing sustained CPU consumption with an idle NPU may be running a CPU implementation by design, may lack an appropriate execution provider or driver, or may be unable to offload the model it was given. A process using the general GPU pipeline rather than a neural engine may still be accelerated, but it is not using the dedicated AI path Microsoft is trying to surface.
That is useful evidence for a help desk ticket, but it is not a final diagnosis. Task Manager can show where the work appears to be going; it cannot identify the unsupported model operator, data type, runtime configuration, or driver capability that made a framework choose another route.
Task Manager can reveal fallback, but it cannot prove full model placement
Microsoft presents the feature as a way to spot execution-provider fallback in real time, particularly for applications built with ONNX Runtime, Windows ML, or DirectML. The underlying premise is sound. Microsoft’s ONNX Runtime documentation says graph nodes unsupported by the explicitly selected execution providers are assigned to the CPU execution provider by default unless developers disable that fallback behavior.
That detail changes how administrators and developers should read the new metrics. A nonzero NPU percentage means an application has work on the NPU; it does not establish that the complete model ran there. A model can be partitioned across providers, with supported portions executed on an NPU or GPU and unsupported operations left on the CPU. In that case, a Task Manager snapshot can show activity on both engines without revealing how much time, copying, or synchronization overhead the split introduced.
Likewise, an idle NPU paired with GPU activity does not automatically mean the app is malfunctioning. Windows ML’s current guidance describes GPUs as appropriate for high-throughput tasks including image, video, and generative AI, while NPUs are intended for sustained, battery-efficient inference. An application may deliberately select a GPU because its model, throughput target, available memory, or provider support makes that the better execution path.
The useful signal is therefore comparative rather than absolute:
- An application expected to use the NPU but showing persistent CPU activity and no NPU-engine entry deserves investigation.
- A process using “GPU – Neural” is reaching a GPU neural path, but developers still need runtime logs or profiling to confirm that the relevant graph segments were assigned as intended.
- Simultaneous CPU, GPU, and NPU use can be normal for preprocessing, rendering, memory transfers, model orchestration, and partial execution-provider support.
Microsoft’s blog recommends re-quantizing a model when neither neural engine is active while CPU or ordinary GPU utilization rises. That can be a valid response for an incompatible precision format, such as feeding FP32 data to an accelerator tuned for INT8, but it is not a universal repair. Unsupported operations, missing drivers, provider installation, execution-provider order, and application-level fallback policy can produce the same Task Manager pattern.
The missing rollout details matter more than the screenshots
The announcement’s largest gap is deployment scope. Microsoft says the feature appears on “some newer devices,” but does not say whether it is tied to a Windows 11 version, a cumulative update, a Task Manager package update, a WDDM level, a particular NPU driver model, or a limited initial rollout.
That uncertainty is especially relevant because Windows ML’s hardware-specific execution providers already have their own compatibility conditions. Microsoft Learn says dynamically delivered Windows ML providers require Windows 11 version 24H2, build 26100 or later, with compatibility varying by device and driver. Its provider documentation names distinct requirements across Qualcomm, Intel, AMD, and NVIDIA hardware, including processor generations and minimum driver versions.
Those execution-provider requirements do not establish the requirements for Task Manager’s new columns. They do show why Microsoft’s broad phrase “supported devices” should not be read as a promise covering every PC with an NPU sticker, a Copilot+ PC badge, or a discrete AI-capable GPU.
For fleet managers, the immediate action is to treat this as a capability to inventory rather than a feature to assume. Test representative devices from every hardware family in the estate, including their current graphics and NPU driver versions. Record whether the columns can be enabled, whether the expected engines appear under load, and whether a known-good local inference workload produces consistent readings.
A documentation problem also remains for remote support: Task Manager is excellent for an interactive spot check, but Microsoft has not announced a corresponding PowerShell, Windows Management Instrumentation, or enterprise telemetry surface for these per-process AI-engine figures. That leaves this iteration primarily as a technician and developer troubleshooting tool rather than a fleet-wide reporting system.
Memory readouts are helpful, with one architectural catch
The Dedicated NPU memory and Shared NPU memory columns are potentially more useful than the utilization counters for troubleshooting performance swings. Microsoft says rising shared NPU memory can indicate that a workload has exhausted a dedicated pool and is using shared system memory, a condition that can reduce performance through added contention and data movement.
But the company also notes that integrated NPUs have no separate dedicated memory pool, so the Dedicated NPU memory column will be empty on those systems. That means an empty field is not evidence of a broken driver, failed accelerator, or inactive NPU. It may simply describe the device’s memory architecture.
This is where Task Manager’s familiar labels can create false comparisons. A workstation with a discrete GPU and plentiful dedicated VRAM, an integrated Intel or AMD platform, and an ARM laptop with a Qualcomm NPU may all show different memory patterns while running workloads that are correctly accelerated for their respective hardware. IT staff should compare a device against its own known-good baseline rather than impose a single expected utilization or memory profile across the fleet.
Microsoft’s battery-life language also deserves restraint. The blog claims CPU and standard-GPU AI workloads can run fans hard and drain a battery “in about two hours,” while NPU and GPU neural paths use far less power. No test configuration, model, display brightness, battery capacity, thermal profile, or measurement methodology accompanies that figure. The general point — dedicated accelerators can improve efficiency for supported workloads — is consistent with the purpose of NPUs, but Task Manager’s Power usage and Power usage trend fields are better used for relative comparisons on the same device than as proof of a universal battery-life gain.
Developers still need runtime diagnostics beside Task Manager
For application developers, the new view is a welcome verification layer rather than a replacement for profiling. Microsoft Learn describes Windows ML as selecting among execution providers for CPU, GPU, and NPU acceleration, while provider packages and updates can vary over time through Windows Update. An app may behave differently after a driver or provider update even when its code and model have not changed.
Developers should use Task Manager while exercising a reproducible inference workload, then pair what they see with execution-provider logs, model profiling, and explicit checks of the provider version installed on the test system. ONNX Runtime can be configured to reject unsupported graph nodes rather than quietly assigning them to CPU, which is often preferable during performance validation. A development build that fails clearly is easier to fix than a production-like test that succeeds slowly through partial CPU fallback.
The feature’s real contribution is that it lowers the cost of noticing a mismatch. A developer no longer has to infer an absent NPU path solely from latency, heat, battery draw, or opaque runtime behavior; a support technician no longer has to tell a user that an AI process is “using the GPU” without knowing whether it is using the GPU’s rendering pipeline or its neural hardware.
Microsoft has delivered a credible diagnostic improvement, but it has not yet delivered a universal AI-performance dashboard. The next concrete step for administrators is to confirm which Windows builds, device classes, and driver combinations expose these readings in their environment — then use a known model workload to establish what correct CPU, GPU, NPU, and memory behavior looks like before the first performance ticket arrives.
Update: Additional details (August 20, 2026)
Neowin reports that Microsoft first listed the per-process NPU metrics in Windows Insider Experimental 26H1 Preview Build 28020.1921 on May 1, before including them in the gradual May 26 preview rollout: KB5089573 for Windows 11 24H2 build 26100.8524 and 25H2 build 26200.8524. The feature was also documented for 26H1 in KB5095091, OS Build 28000.2340, released June 23.
The expanded column set reportedly includes NPU and NPU Engine in the Processes, Users, and Details pages, while NPU Dedicated Memory and NPU Shared Memory are confined to Details. That gives shared-PC and remote-access support teams an additional way to associate accelerator activity with a signed-in user, not just an executable.
Update: Additional details (August 20, 2026)
Xenospectrum reports that the feature’s non-security improvements were incorporated into KB5094126 on June 9, 2026, following the May 26 KB5089573 preview release for Windows 11 24H2 and 25H2. The outlet also says the NPU and NPU Engine columns can be enabled in the Processes, Users, and Details tabs, while NPU Dedicated Memory and NPU Shared Memory remain limited to Details.
The same report identifies a separate new Isolation column in Processes and Details. It indicates whether an application is running in an AppContainer, providing execution-context information alongside AI-engine activity; it is not a performance or security verdict.
