

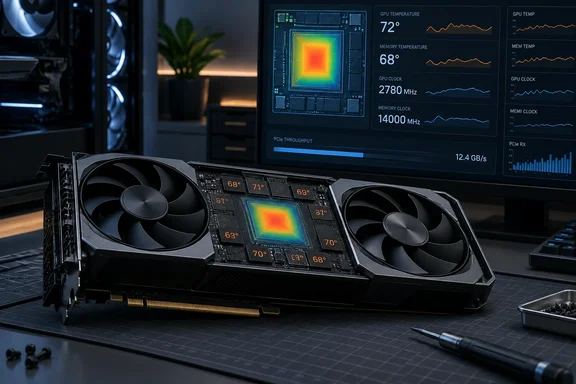
GPU-Z 2.71.0 Brings Back the RTX 50 Hot Spot Sensor
The top changelog entry in version 2.71.0 reads: "Added GeForce 50 Hot Spot thermal sensor and the hottest memory chip is also reported (tooltip shows all memory chip temperatures)". VideoCardz and TechSpot's download listing both reproduce the same changelog, and TweakTown covered the release on its own. TechSpot's listing gives the version as 2.71.0, the developer as TechPowerUp, the license as freeware, the platform as Windows, the file size as 11.1 MB, and offers installer and portable downloads.
There are two new readings. The hot-spot sensor gives the temperature of the hottest point on the GPU, which is not the same as the standard "GPU Temperature" figure that most people check. The memory reading shows the hottest memory chip by default, and hovering the mouse over it lists the temperature of every chip on the card. TweakTown describes this as reporting the hottest GDDR7 memory chip on those cards. TechPowerUp's reasoning is that graphics memory is interleaved to maximize bandwidth, so every chip should run at about the same temperature. A single chip running much hotter than the rest points to uneven cooling on that part of the board.
The changelog does not list which RTX 50 models are supported or which driver versions are needed. TweakTown says the sensor covers the GeForce RTX 50 series broadly, covering Blackwell GPUs. The safe assumption is that most RTX 50 cards will show the readings. If yours doesn't, the tool isn't necessarily broken.
Why the Missing Blackwell Hotspot Mattered
The reading had been missing since early 2025. The change was confirmed when GeForce RTX 5090 reviews went live in January. GPU-Z developer W1zzard told VideoCardz that NVIDIA had removed hotspot access from its public API. Monitoring programs initially displayed an invalid reading of 255°C. GPU-Z 2.62.0 later stopped showing the field when this value was detected, while retaining hotspot monitoring for RTX 40 cards. At the time, TechPowerUp's position was that NVIDIA had removed the sensor, while you still have access to "GPU Temperature" and "Memory Temperature". While there was always some drama around Hot Spot, it was useful to diagnose a misaligned cooler or waterblock.
In July 2026, Brazilian repair technicians showed the sensor was still on the hardware. They used NVIDIA's MODS suite. MODS, short for Modular Diagnostic Software, is NVIDIA's proprietary suite for testing GPUs, memory and other board functions. It is intended for internal diagnostics, manufacturing and repair work. On a Gigabyte GeForce RTX 5070 Ti, the card reported an average GPU temperature of around 67°C to 68°C, while MODS showed the hotspot rising above 100°C. The diagnostic log showed that the hotspot reached NVIDIA's 107°C thermal limit five times during one test, causing the GPU to reduce its clock speed. When they opened the card, the technicians found dried-out thermal material and a patch of poor contact between the GPU and the cooler. Replacing it brought the hot-spot peak down to about 100°C.
This is why the new sensor is more than a curiosity. The standard temperature reading alone did not show the problem. Digital Citizen noted that this does not prove that every RTX 50 GPU has a cooling problem. It does show that some affected cards may be harder to diagnose without hotspot data. One repaired card is an anecdote, not a failure rate. It does show the kind of fault a hot-spot sensor catches and an average reading can miss.
GPU-Z Follows HWMonitor and HWiNFO, but TechPowerUp Hasn't Said How
GPU-Z is not the first Windows tool to bring the reading back. HWMonitor added RTX 50 hotspot monitoring in July, while HWiNFO followed with Blackwell hotspot support in its August 2026 release. HWiNFO also added per-chip GDDR6X and GDDR7 temperature monitoring. In HWiNFO's case, VideoCardz reported that RTX 50 hotspot data is hidden from NVAPI and can only be accessed through direct GPU register reads. NVAPI is NVIDIA's public programming interface for its drivers. Not every tool can take that route: MSI Afterburner developer Alexey "Unwinder" Nicolaychuk explained that he cannot add RTX 50 hotspot monitoring directly to Afterburner for legal and marketing reasons.
TechPowerUp has not explained how GPU-Z gets the reading. VideoCardz wrote that it is not yet clear what changed with the new GPU-Z implementation. NVIDIA may have provided TechPowerUp with access to the sensor through a supported interface, or the GPU-Z developers may now consider the alternative method reliable enough for wider use. Treat both as guesses. The practical risk is the one VideoCardz points to: a reading that doesn't come through NVIDIA's public API could be removed again if something changes, as happened with GPU-Z 2.62.0.
It's also unclear what exactly is being measured. When HWiNFO added support, its developers found two possible temperature sensors and had not yet confirmed which one represents the GPU hotspot. The current theory is that one sensor reports the GPU hotspot while the other may track the VRM hotspot. HWMonitor shows two values for the same reason. GPU-Z 2.71.0 shows a single hot-spot sensor. If you compare it with another tool, make sure you're comparing the equivalent reading, and don't assume RTX 50 hot-spot numbers match RTX 40 figures exactly.
New NVIDIA Clock Readouts in the Advanced Tab
The second group of changes is for tuners. GPU-Z 2.71.0 adds an "overclocking" readout on the Advanced tab for NVIDIA GPUs. According to the changelog, it reports overclock frequencies for internal clock domains, including XBAR, SYS and the video clock, plus boost lock status. TechPowerUp describes XBAR as the crossbar clock. The changelog doesn't define SYS beyond the label. Boost lock status tells you whether the card is being held at a fixed boost clock, which is useful when a benchmark result looks suspiciously flat.
The release also adds sensors for NVIDIA's SYS, L2 cache and video clocks. These three sensors are disabled by default. You have to turn them on in GPU-Z's sensor settings before they appear on the Sensors tab. If you install 2.71.0 and don't see them, check that setting before assuming your card isn't supported.
Not every NVIDIA GPU fills in the new overclocking data. VideoCardz noted that the extra data doesn't appear on its RTX 3070 Laptop GPU, but at least you know where to look. The changelog doesn't say which generations or form factors support the readout, so some older cards and laptop GPUs may show nothing there.
A new sensor reports PCI Express bandwidth throughput in GB/s on NVIDIA GPUs. The changelog only calls it throughput. TweakTown says the sensor tells you how much PCIe data throughput the GPU is using at the moment, meaning live traffic rather than the link's rated speed. That makes it a separate check from GPU-Z's existing link-configuration test, which TechSpot describes as a GPU load test to verify PCI-Express lane configuration. The link test tells you what the slot has negotiated. The new sensor tells you how much of it is being used.
One small interface change matters if you log sensors to a file. On the Sensors tab, a sensor's dropdown arrow is now grayed out when that sensor isn't being logged. If you're setting up a long capture, for example logging the new hot-spot and memory readings while chasing a throttling problem, a quick look at the arrows now confirms what will end up in the log.
New Hardware Support: RTX 5060 GB205, Steam Machine GPU, Panther Lake and Snapdragon X2
The support list is long. These entries mean GPU-Z can now correctly identify these chips. They are not hardware launches. New additions include:
- On NVIDIA, the RTX 5060 (GB205), RTX 4070 10 GB, RTX PRO 4500 Blackwell Server, an H100 PCIe variant, a Tesla V100-SXM2-16 GB variant, and the P102-101.
- On AMD, the Steam Machine GPU and a second variant of the Radeon PRO V710.
- On Intel, Panther Lake, Lunar Lake, Arrow Lake H (285H, 265H, 255H, 235H, 225H), RPL-H Refresh (240H, 210H), and Twin Lake (N355, N350, N250, N150).
- On Qualcomm, the Snapdragon X2-90, X2-85 and X2-45.
Two entries stand out. The RTX 5060 is listed with a GB205 die, and TweakTown's headline calls the RTX 4070 10 GB unreleased. Listing a device ID in a monitoring tool shows TechPowerUp has seen or expects that hardware. It doesn't confirm retail availability, pricing or regions, so don't read the changelog as a product announcement. The Twin Lake N-series and Snapdragon X2 entries are more immediately useful: they cover the low-cost mini PCs and Windows on Arm laptops that people often check with GPU-Z to confirm what they bought.
Reporting Fixes for LPDDR5X, Alder Lake and DDR5 Systems
The fixes are about what GPU-Z reports. None of them changes system performance. Version 2.71.0 fixes LPDDR5X memory detection on Intel Meteor Lake and Arrow Lake, LPDDR5 frequency reporting on Intel Alder Lake, and memory bandwidth reporting on "some DDR5 systems". It also corrects the transistor count listed for NVIDIA's GP102 and the unit counts for Qualcomm's Adreno 726 graphics.
The Intel fixes are the ones most likely to have confused owners of thin-and-light laptops with integrated graphics. Integrated GPUs use system memory, so a wrong memory type or frequency in GPU-Z's graphics card view could make a machine look misconfigured when it wasn't. The DDR5 bandwidth fix doesn't say which configurations were affected. If you've been getting an odd bandwidth figure on a DDR5 desktop, update and check again before digging further.
What This Means for RTX 50 Owners and Everyone Else
RTX 50 owners who want a thermal health check should update. Anyone else can update when convenient, with more reason to do it soon if you have one of the listed Intel or Qualcomm platforms or a DDR5 system that showed wrong numbers. GPU-Z only reads information. TechSpot's FAQ notes that GPU-Z is an informative utility only and that it cannot change fan speeds or overclock. Updating it doesn't touch your GPU's settings.
- RTX 50 owners can now see a hot-spot temperature and per-chip memory temperatures in GPU-Z 2.71.0. The standard temperature reading alone has missed hot-spot throttling on at least one repaired RTX 5070 Ti.
- Hover over the memory temperature to see every chip. One chip running well above the others suggests uneven cooling on that part of the board.
- The SYS, L2 and video clock sensors are off by default. Turn them on in sensor settings before assuming they're missing.
- The new NVIDIA overclocking readout on the Advanced tab may stay empty on some GPUs, including at least one RTX 30-series laptop chip.
- The PCIe sensor shows throughput in GB/s, which TweakTown describes as current usage rather than link capability, so use it alongside GPU-Z's existing lane-configuration check.
- TechPowerUp hasn't explained how GPU-Z reads the RTX 50 hot spot. If you compare it with HWiNFO or HWMonitor, make sure you're comparing the same sensor.
GPU-Z 2.71.0 means the three most widely used free Windows monitoring tools that can offer the reading (GPU-Z, HWMonitor and HWiNFO) now show RTX 50 hot-spot data, about 20 months after NVIDIA removed it from its public API. RTX 50 owners have a practical way to catch the dried-paste and poor-contact faults that repair technicians found this summer. How long this lasts depends on the access method TechPowerUp hasn't disclosed. If a future NVIDIA driver blocks it, the field could disappear again the way it did in GPU-Z 2.62.0.