

Why a solar storm is an IT problem
Grid reliability matters to the people who run datacenters and enterprise infrastructure. When a large storm hits, the usual problem is not a frazzled laptop. It is the electricity the whole stack depends on.
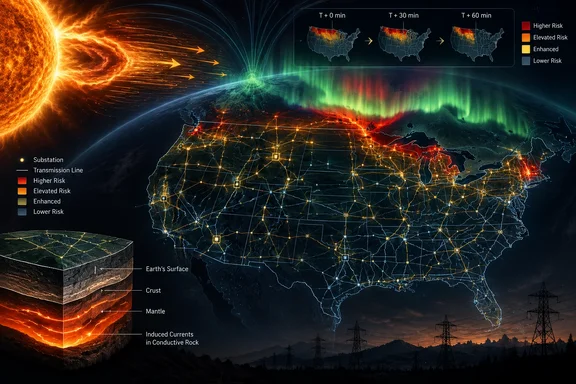
The U.S. Department of Energy explains how the damage happens. During a geomagnetic disturbance, long transmission lines act like a continent-sized generator and pick up geomagnetically induced currents (GICs). Those currents distort the normal alternating current, which can heat and damage transformers. If the effect is large and widespread enough, it can disrupt system voltage and cause a blackout. That is what happened in Quebec in 1989.
Kannan uses the May 2024 geomagnetic storm as the recent example. Utilities across North America prepared for possible impacts, auroras appeared far outside their usual range, and GPS and satellite operations were degraded. He argues that the hard part is not knowing a storm is coming. It is working out when and where its effects will be worst, early enough for grid operators to act.
Section summary: Geomagnetic storms can damage transformers and destabilize grids. The open question is where and when, not whether.
How the pipeline works
Microsoft describes the system in three stages:
- Space-weather inputs. Solar-wind measurements from the L1 Lagrange point feed forecasts of two geomagnetic indices: the Auroral Electrojet (AE) index and the Disturbance Storm Time (Dst) index. At the same time, location and geological-conductivity features are assembled for every substation.
- Local magnetic change. A gradient-boosting model combines the forecast indices with each location's features to estimate dB/dt, the rate at which the local magnetic field is changing. This is the quantity tied to GIC risk.
- Risk mapping. The per-location predictions become risk estimates, which are then rolled up into a continental assessment. The aim is to replace one national alert with a map that separates lower-risk areas from higher-risk ones.
Choosing dB/dt as the target follows established science. A NOAA-linked machine learning paper posted to arXiv says the induced electric fields that cause GICs can be estimated from the amplitude of the time derivative of magnetic fluctuations, often denoted as dB/dt, when combined with information of local earth conductivity characteristics. A 2023 study in Space Weather that analyzed data from EPRI's SUNBURST monitoring network makes a similar point: it is not the magnitude of the storm that defines the level of GICs but the induced geoelectric field, which is determined by a combination of geomagnetic variations, dB/dt, and the ground conductivity.
That is why the model takes geology into account. According to Microsoft, areas with resistive bedrock can see stronger GICs than areas with more conductive ground. Latitude, transmission-line orientation and other grid characteristics also change how exposed a given asset is. Two substations facing the same storm can end up with very different risk.
Microsoft says it used only public data:
- NASA OMNI solar-wind data
- Kyoto World Data Center data, as aggregated by NASA
- INTERMAGNET and U.S. Geological Survey magnetometer observations
- Grid data derived from GridSFM
Microsoft also says a system of 50 AI agents helped explore features, validation strategies and model configurations. The post does not explain what each agent did or how their output was checked. The evidence shows they assisted during development. It does not show that they run the forecasts.
Section summary: The model forecasts storm indices from solar-wind data, converts them into local dB/dt estimates using location and geology, and maps the results across the country.
The results in numbers
The evaluation covered 2020 through 2026. Here is what Microsoft reports:
| Component | Reported result | Compared against |
|---|---|---|
| AE predictor | 410.2 nT RMSE | Lower error than empirical and solar-wind-only baselines |
| Dst predictor | 7.2 nT RMSE | Beat the Burton equation on 62.2% of the most active hours |
| Adding Dst to the full system | +1.2 percentage points in severe-event detection | Same system with AE forecasts only |
The GIC-risk stage was harder to benchmark. Microsoft says no widely deployed operational system offers a direct industry comparison, so it compared the model against simple linear regression. The reported detection rates by severity threshold were:
- 76.5% for major events (≥10 nT/min)
- 81.2% for severe events (≥20 nT/min)
- 64.1% for extreme events (≥50 nT/min)
The post's summary says the system caught "nearly 80%" of major events. The detailed figure for the major threshold is 76.5%, which is the number to use.
These are detection rates, not overall accuracy. Microsoft says false-alarm rates rose as storms got more severe but gives no numbers for them. Without false-alarm figures, readers cannot judge how many of those detections came with warnings about storms that never materialized. Detection was also strongest at northern stations, where geomagnetic activity is greatest. The extreme tier, at 64.1%, is the weakest result, and extreme storms are the ones that could damage transformers.
Speed is a genuine strength. Microsoft measured about 333 milliseconds of inference time to produce estimates for all 66,935 substations. That number covers the model only. It does not include collecting data, producing the upstream forecasts, delivering alerts or the time a utility needs to act. Still, it means planners could run many storm scenarios very quickly.
Section summary: Detection is fairly strong for major and severe events, weaker for extreme ones, and the missing false-alarm numbers make the results hard to judge fully.
How new is this?
Machine learning forecasts of dB/dt are not new. Earlier arXiv work described a gray-box model for a probabilistic estimate of regional ground magnetic perturbations designed to improve NOAA's operational Geospace model. A 2019 AGU abstract on physics-informed machine learning noted that forecasting GICs begins with forecasting dB/dt, or the rate of change of the surface magnetic field.
What Microsoft's project adds is the end-to-end chain and the level of detail. It goes from L1 solar-wind data through storm indices to local dB/dt, then to a risk estimate for each substation, run on a realistic model of the U.S. transmission grid.
There is a known weak point in this approach. A paper on substorm dB/dt warns that knowledge of ground conductivity is the largest source of errors in the determination of GICs. Microsoft's model depends heavily on geological conductivity inputs, so any gaps in those maps carry through to the substation risk estimates.
Grid operators are not starting from zero either. NERC reliability standard EOP-010-1, "Geomagnetic Disturbance Operations," already requires operating plans and procedures for these events. A research model like this one would have to fit into those existing workflows rather than replace them.
What utilities could do with a 30–60 minute warning
Microsoft suggests location-specific warnings could help utilities decide where to focus engineering review first. They could also support targeted protective steps, such as adjusting reactive-power reserves or temporarily reconfiguring parts of the network. These are proposed uses. None has been tested with the system.
The published continental risk map is also a demonstration of a representative major storm. It is not a record of a live event, and it is not a reconstruction of the May 2024 storm.
Microsoft lists four next steps:
- Longer forecast horizons, using temporal-transformer models to push past the current 30–60 minute window
- Other countries, adapting the model to different geology and grid layouts
- Working with grid operations, testing whether the forecasts help existing decision-making before adding more automation
- Transformer-level risk, adding equipment-specific details to go beyond substation-level estimates
The project links to other Microsoft Research power-grid work. That includes an open grid-data pipeline that builds realistic U.S. transmission models, and GridSFM, a small foundation model that uses deep learning to solve AC optimal power flow quickly. Microsoft suggests hazard forecasts, grid topology and power-flow analysis could eventually be combined in planning tools. Nothing published so far shows that combined system exists.
Analysis: promising, but still an internship prototype
In my view, this is a well-reasoned piece of applied research. It targets the physically relevant quantity, accounts for geology, runs quickly, and is honest about its limits. The caveats matter just as much: it comes from one internship, it is benchmarked mainly against linear regression, the false-alarm rates are not published, and it has not been validated with utilities.
For readers who run infrastructure, the takeaway is simple. Space weather belongs in business-continuity planning, and research like this could eventually make warnings more location-specific. For now, planning should still rely on existing utility procedures and official space-weather warnings, not on this model.
References
- Forecasting space weather risks on power grids - Microsoft Microsoft · 2026-09-30T16:00:00+00:00
- A gray-box model for a probabilistic estimate of regional ground magnetic perturbations: Enhancing the NOAA operational Geospace model with machine learning arxiv.org
- Quantifying Risks to the Electricity System from the Sun | Department of Energy energy.gov