

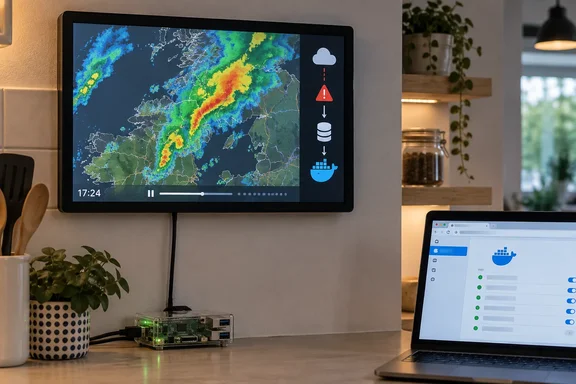
XDA-Developers highlighted the project after creator Alex Soul posted it to the Raspberry Pi subreddit. Soul described it as deliberately narrower than a Home Assistant dashboard: a glanceable display of the previous few hours of rain, intended to let someone judge a storm’s direction rather than accept a generic precipitation percentage. The GitHub documentation supports that description, but it also reveals a more capable—and less finished—project than the initial coverage suggests.
The important correction is straightforward: Pi Rain Radar does not itself predict rain from radar motion. Its primary display animates historical radar imagery. That is useful for a human making a near-term judgment, especially when a rain band has a clear direction and speed, but it is not equivalent to a meteorological nowcast. The optional next-hour forecast comes from a separate OpenWeather integration and requires the user’s own eligible API key.
A weather screen that keeps working after the feed fails
The core design is unusually sensible for a wall-mounted home display. Rather than make every browser screen fetch weather imagery independently, Pi Rain Radar runs a backend that obtains the map frames, stores them in its Docker volume and serves the processed result to connected browsers. One Raspberry Pi can therefore drive several displays around a home without multiplying radar downloads or each screen maintaining its own data cache.
That separation produces the project’s best feature: an upstream outage does not immediately turn the display into a blank rectangle. The application can keep playing its latest complete radar frames, flags delayed data in the interface, and resumes acquiring current frames after the provider becomes available again. Hackster independently described the same behavior in its coverage of the project.
There is an important limit. Cached playback is evidence of what the system last received, not proof that conditions remain unchanged. The project’s own documentation warns that radar data may be delayed or incomplete, and an area without rain colouring can mean either no detected rain or no available data. The status markers are therefore more than interface decoration; they are necessary context for interpreting the display during a provider outage.
Pi Rain Radar can show two, four or six hours of animation and builds a rolling seven-day local history while it remains online. It supports RainViewer without an API key, while an optional Rainbow Weather source requires a Tiles API key. Users can select providers separately for the main and overview maps, which offers a practical fallback for people willing to configure more than one source—but there is no automatic switchover when one provider fails.
The source reporting understates its Windows option
Although it is named Pi Rain Radar and the recommended setup is a Raspberry Pi 4 with 2GB of memory and a 1280×720 touch display, the repository ships prebuilt ARM64 and AMD64 images. That means the project is not restricted to Raspberry Pi hardware.
The project’s Quick Start documentation explicitly supports Windows and macOS through Docker Desktop, provided Windows is configured to use Linux containers. A Windows PC can host the application, open it locally in a browser, or make it available to other devices on the home network. That makes it viable as a test deployment for people who want to try the interface before committing a Pi and display to a permanent kiosk.
Windows users should treat that option as a host deployment rather than a turnkey appliance. The documentation states that the machine must stay awake for radar collection and history recording to continue; sleep interrupts the service. A desktop PC also makes less sense as a 24-hour, low-power wall display than a Pi, but it can be a convenient way to verify whether the available radar coverage is worthwhile in a particular location.
The application listens on port 3080 by default. Its documentation is unusually direct about a security constraint that hobby projects often skip: browser access uses unencrypted HTTP, including when entering an optional settings PIN or API keys. The developer says the LAN mode is intended only for a trusted home network and specifically warns users not to forward port 3080 through a router to the public internet. Anyone hosting it on Windows should take that seriously: do not create a router rule for it, and use the documented loopback bind setting if there is no need for other devices to reach the service.
A polished pre-release with versioning loose ends
The project is MIT-licensed, has extensive installation and recovery documentation, and includes a conventional Docker Compose deployment rather than asking users to install Node.js, clone source code or build containers locally. It also has several touches aimed at an unattended household display: a six-digit settings PIN, per-display layouts, touch controls, light and dark themes, an optional restart/shutdown control, and automatic browser reloads after certain upgrades.
But it remains a pre-release, and its documentation shows the rough edges that designation implies. The repository currently identifies v0.4.1 as the pre-release version and says the maintainer tested it on a Raspberry Pi 4 with 2GB RAM, including ARM64 tests and startup/restart checks. The same status note says a prolonged soak test is still pending.
There is also a version discrepancy worth knowing before anyone deploys it as an appliance. Hackster’s report refers to v0.1.2, while the GitHub landing page now identifies v0.4.1. More notably, the Quick Start instructions for a fresh Raspberry Pi or Linux install still download a Compose file pinned to v0.1.2, whereas the repository’s general Docker instructions say a configuration taken from the main branch will run the latest published image, including pre-releases.
That may be an intentional effort to give new users a more conservative setup path, but the documentation does not make the distinction sufficiently plain. The practical consequence is that users should decide whether they want a fixed, documented version or the project’s latest pre-release before copying commands. “Latest” is not automatically safer in a device intended to run unattended, and the repository itself says its latest channel includes pre-release builds.
Radar imagery is useful, but it is not a weather oracle
The project’s appeal comes from narrowing the task. Full weather dashboards often crowd a display with temperatures, pressure, wind, humidity, calendars and forecasts. Pi Rain Radar can add some of those through OpenWeather, but its central experience is a moving rain map with minimal clutter. It is a better fit for a kitchen, hallway or workshop display than another dense status page competing for attention.
Its value will depend heavily on local radar coverage and the reliability of the selected provider. RainViewer’s public API is intended for personal, educational and small-community use, according to the project’s third-party notices; the repository says commercial users need to verify the provider’s terms separately. The optional Rainbow Weather integration also needs attention to usage because map-tile requests can consume a provider allowance over a month.
For a home-lab user, the worthwhile part is the deployment model: one lightweight service, local storage, browser-based clients, and a purpose-built display that fails gracefully when an external API stalls. For someone hoping for a guaranteed rain forecast, the project is more modest. It gives you recent observations and the tools to make a fast judgment—provided you notice when the data has gone stale.
References
- This awesome weather-based Raspberry Pi project lets you know if rain is on the way XDA · 2026-09-18T05:20:26+00:00