

Microsoft Research has introduced Flint, a visualization intermediate language for AI-driven chart creation, in a research blog post with no stated publication date that describes how AI agents can turn simple, human-editable specifications into polished charts across Vega-Lite, Apache ECharts, and Chart.js without rewriting them from scratch. The claim is not merely that AI can draw charts; everyone who has watched a chatbot emit a plausible bar chart already knows that. Microsoft’s sharper argument is that chart generation needs a semantic middle layer, because asking language models to hand-author verbose visualization-library specifications is a recipe for brittle output. Flint is Microsoft Research’s attempt to make chart intent compact enough for agents to generate, explicit enough for humans to edit, and rich enough for compilers to turn into serious visualizations.
The timing matters because AI-assisted data analysis is moving from demo-land into everyday workflows: chat windows, coding environments, notebooks, internal dashboards, and analyst copilots. In that world, a chart is not just decoration at the end of an answer. It is often the answer’s evidence, and if the chart silently mishandles dates, scales, baselines, labels, density, or color, the user may trust a conclusion that the visualization itself has distorted.
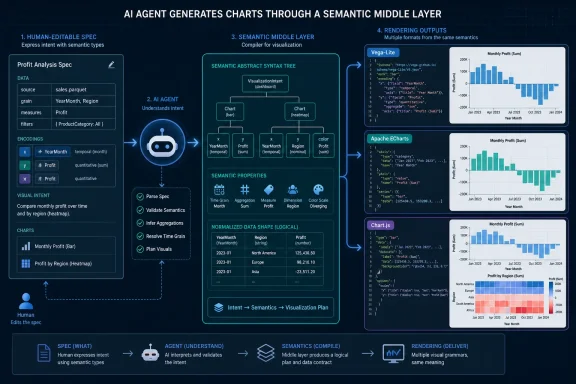
The most useful way to understand Flint is to stop thinking of it as another charting library. Microsoft Research describes it as a visualization intermediate language, which places it between human or agent intent on one side and rendering libraries on the other. That is a deliberate architectural choice: instead of making the model produce a full Vega-Lite, Apache ECharts, or Chart.js specification directly, Flint asks for a smaller expression of what the chart is supposed to mean.
That distinction is the heart of the project. Modern visualization systems already expose enormous control over axes, scales, formatting, spacing, colors, aggregation, legends, and layout. The problem, as Microsoft’s source material frames it, is that these controls create a trade-off: short specs that rely on defaults are often dull or wrong in subtle ways, while polished visualizations require verbose, fragile parameters that are easy for both people and agents to get wrong.
This is a familiar pattern in software. Developers do not generally want to hand-write assembly when a compiler can reason from higher-level intent. Web authors do not want to specify every glyph position when a layout engine can calculate flow. Flint applies the same argument to visualization: if the system understands the semantic role of the data and the intended chart mapping, it can derive much of the low-level machinery.
That matters more for AI agents than it does for expert human chart authors. A skilled visualization engineer may know when a scale should begin at zero, how to format a year-month field, or when a diverging color scale is appropriate. A language model may guess convincingly, especially when the output is syntactically valid. Flint’s bet is that making the model express meaning rather than low-level rendering mechanics gives the compiler the part of the job it is better suited to perform.
That is more than metadata decoration. If a compiler knows a field is a year-month value, it can make different choices than it would for a generic string. It can parse temporal values, format axes appropriately, and avoid treating months as arbitrary categories. If it knows a measure behaves like profit, it can choose formatting, baselines, and color schemes that better match the semantics of positive and negative values.
This is where Flint diverges from the usual “AI writes chart code” pitch. The project is not asking the model to be a perfect visualization specialist. It is asking the model to identify a smaller and arguably more natural set of facts: this field is a date-like period, this field is a measure, this value has financial meaning, this chart should map one field to color and another to an axis.
Microsoft Research argues that semantic types are often easier for language models to infer than a complete set of low-level visualization parameters. That is plausible because field names, value patterns, and common domain knowledge often reveal meaning before they reveal optimal rendering settings. A column named
The practical consequence is important for Windows users and developers working inside AI-assisted tooling. If chart generation becomes part of chat and coding workflows, users need output that is inspectable. A compact Flint spec that says what a field means is far easier to review than a dense backend-native specification stuffed with layout, scale, and formatting decisions. The human can challenge the semantic claim — “is this really profit?” — without reverse-engineering every rendering parameter.
Flint moves that work into a compiler. According to Microsoft Research, the Flint compiler derives optimized chart settings from the data, semantic types, chart type, and encodings. It can manage parsing rules, scales, axes, aggregations, formatting, color schemes, layout, and backend-native specification generation. The user does not have to explicitly configure every fragile detail.
That compiler-centered design is the project’s strongest claim. Flint automatically manages sizing, spacing, labels, and layout so charts remain readable as cardinality and density change, without explicit user configurations. In plain English: the chart should not fall apart just because the number of categories grows, labels get longer, or the data becomes denser.
This is one of the areas where AI chart demos often look better than AI chart workflows. A single carefully selected dataset can produce a nice screenshot. A production analysis environment has changing data, edge cases, and users who ask follow-up questions. If every change requires the agent to rewrite low-level layout logic, the system becomes fragile. If the compiler can adapt layout from the higher-level chart intent, the same specification has a better chance of surviving real data.
Microsoft’s heatmap example captures the point neatly. A high-quality heatmap requires decisions about processing the period field, labeling year-month values, sizing cells, and choosing a color scale that represents positive and negative values appropriately. Without those decisions, a rendering library may still produce a technically valid chart, but technical validity is a low bar. A misleading chart can be syntactically perfect.
The phrase “technically valid but potentially misleading” is the quiet warning underneath the whole project. AI systems are already good at producing artifacts that look finished. The danger is that a chart can look authoritative while embedding bad assumptions. Flint’s answer is not to make the language model more verbose; it is to make the specification less about rendering trivia and more about chart semantics.
For developers, that separation is attractive because charting-library choices are rarely permanent. A team may prototype with one system, embed interactive visualizations with another, and standardize production dashboards around a third. If the chart’s meaning is trapped inside a backend-native specification, moving it can mean rewriting more than just syntax. It can mean rediscovering every design decision encoded in the original.
Flint’s intermediate representation gives Microsoft a cleaner story for agentic workflows. The agent can generate a compact Flint specification, validate it, render it, and potentially compile it into whichever backend the environment requires. The system does not have to ask the model to become simultaneously fluent in Vega-Lite, Apache ECharts, and Chart.js internals every time a user asks for a chart.
This also changes the failure mode. If a model directly emits a complex Vega-Lite spec and the result is wrong, the user must decide whether the problem is the data mapping, the Vega-Lite syntax, the scale configuration, the labels, the aggregation, or the prompt. If the model emits Flint and the compiler emits the backend-native spec, debugging can move up a level. The human can inspect the intent, while the system owns the translation.
There is a catch, of course. Any intermediate language has to justify its abstraction. If it hides too much, experts will fight it. If it exposes too much, agents will struggle with it. Microsoft Research’s pitch is that Flint’s specification is compact and human-editable while still expressive enough to generate polished charts. That balance will determine whether Flint becomes a useful layer or just another format in an already crowded visualization stack.
The scores are not a crushing blowout, and Microsoft’s source material does not present them as one. The important signal is consistency. Flint beats the direct Vega-Lite baseline across the three named models, suggesting that the abstraction may help across model tiers rather than only with a single model configuration.
That is exactly the kind of result an intermediate language needs. If Flint only helped weak models, it might be a temporary crutch. If it only helped the strongest model, it might be a benchmark artifact. The reported results instead support a narrower but more durable claim: when models are asked to generate chart intent in Flint rather than full Vega-Lite directly, the resulting charts score better in Microsoft’s LLM-judge evaluation.
Still, the evaluation should be read carefully. The source material says the comparison used an LLM self-evaluation pipeline, which means the judge itself is model-mediated. That does not make the result meaningless, but it does mean the score is not the same thing as a large blind human study of chart comprehension, accessibility, and analytical correctness. A stronger future case for Flint would pair automated judging with human evaluation and real-world task success.
Even so, the baseline choice is revealing. DirectVL represents the straightforward way many AI chart systems are built: ask the model to output the final spec. Flint’s win is an argument against that direct-generation approach. The more complex the target format, the more likely the model is to spend its effort on syntactic and library-specific detail rather than the user’s analytical intent.
Data Formulator is a fitting host because AI-assisted data analysis is where chart generation gets messy fastest. Users do not merely ask for a chart once. They ask to group, filter, transform, compare, explain, and refine. Each follow-up can change the data shape, the intended comparison, and the density of the display. A chart spec that was adequate for the first answer may become awkward or wrong three turns later.
That is where Flint’s layout and semantic claims become operationally important. If the system can carry forward chart intent and recompile it as the data changes, an agent can support iterative analysis without constantly rebuilding fragile backend specs. The user can remain in the analytical conversation instead of becoming an unwilling visualization debugger.
The connection to Data Formulator also hints at a broader Microsoft Research strategy. The company is not only building models or adding chat boxes to existing tools. It is creating intermediate structures that make AI outputs more reliable inside specialized domains. In that reading, Flint is part of a wider shift from “let the model do everything” to “let the model express intent, then let domain systems enforce structure.”
That shift is welcome. Large language models are powerful, but they are not compilers, layout engines, visualization grammars, or statistical validators. The best AI-assisted tools increasingly look like hybrids: the model interprets the user, proposes a plan, and fills in high-level structure; deterministic software handles the parts where precision, consistency, and repeatability matter. Flint is a clean example of that hybrid architecture.
MCP matters because it gives AI clients a standardized way to call tools. In Flint’s case, those calls can embed data inline or read configured local files, and the server can open an interactive chart view. That means an agent can move beyond describing a chart in prose or dumping code into a message. It can ask a charting tool to validate and render the result where the user is already working.
For Windows developers and IT pros, this is the part to watch. AI coding environments are quickly becoming places where analysis happens, not just places where code is written. A developer investigating telemetry, a support engineer looking at incident data, or an administrator reviewing inventory can plausibly ask an agent to visualize a local dataset. Flint’s MCP server gives that workflow a more structured path than “generate some JavaScript and hope it runs.”
The local-file capability is useful but also operationally sensitive. If MCP calls can read configured local files, administrators need to understand what files are configured, which clients can invoke the server, and whether rendered charts could expose sensitive data. The source material does not describe a security model, so it would be irresponsible to infer one. The practical guidance is simpler: treat an agent-connected visualization server as a tool with data access, not as a harmless UI widget.
This is also why validation is central. An agent that can create, validate, and render charts has a tighter feedback loop than an agent that merely writes a spec. It can find errors earlier, show the user an interactive result, and support refinement. In the best case, the user reviews a chart instead of a block of code; in the safer case, the system makes the generated artifact inspectable before anyone relies on it.
A closed black box that “makes charts better” would be hard to trust in serious analytical settings. The whole point of Flint is that low-level decisions are derived from semantics and encodings. Developers and visualization experts will want to know how those derivations work, where the defaults come from, and how the compiler behaves in edge cases.
The open-source component also creates the possibility of backend-specific scrutiny. Vega-Lite, Apache ECharts, and Chart.js do not have identical models. They differ in grammar, rendering behavior, interactivity, ecosystem expectations, and the kinds of charts developers commonly build with them. A single intermediate specification that targets all three must make translation choices, and those choices deserve review.
This is where community adoption could improve the project. Visualization is full of domain-specific expectations: finance charts, scientific plots, operational dashboards, accessibility requirements, localization, and reporting conventions all impose different demands. If Flint is going to become a serious semantic layer, it will need pressure from users who care about more than a polished demo.
The danger is that “visually polished” becomes a proxy for “good.” A chart can look refined and still be analytically poor. It can use attractive colors while choosing a questionable baseline. It can avoid label overlap while emphasizing the wrong comparison. Flint’s semantic approach helps, but it does not eliminate the need for judgment. Open source at least gives practitioners a place to examine the judgment being encoded.
In Windows environments, the likely early adopters are not casual users building one-off graphics. They are developers, analysts, administrators, and support teams using AI clients to understand structured data. That could mean logs, tickets, financial exports, telemetry, asset inventories, performance data, security findings, or product metrics. In each case, a chart can compress complexity — and in each case, a bad chart can compress it badly.
Flint’s promise is that the agent does not have to become an expert in every rendering library before producing something useful. A support engineer should be able to ask for a heatmap of incident volume by month and category without needing to specify temporal parsing rules, cell sizing, legend configuration, and label spacing. A developer should be able to iterate on a visualization without watching the model bloat a backend spec into something nobody wants to maintain.
The same logic applies to education and documentation. If AI assistants are going to generate charts inside tutorials, code samples, or internal knowledge bases, a compact human-editable spec is easier to review than backend-native boilerplate. It can be stored, diffed, discussed, and corrected. That makes the chart artifact less magical and more like a normal part of the software workflow.
But the Windows enterprise angle also brings risk. Agent tools that read local files and render data need governance. Even if Flint itself is just a visualization layer, it may be invoked inside environments with sensitive data. The more seamless the workflow becomes, the more important it is to define boundaries before the first executive dashboard or incident report depends on an agent-generated chart.
AI agents seem like an answer because they are good at interpreting human requests. But direct generation pushes them into a role they are less reliable at: producing long, precise, low-level specifications in a target library’s format. The more parameters the model must juggle, the more places there are for small errors to become visual lies.
Flint’s most interesting contribution is the claim that meaning should be first-class. The chart spec should not merely say “put this field on x and that field on y.” It should help the compiler understand what those fields are. Dates, prices, percentages, countries, rankings, correlations, and profits carry expectations. A system that knows the meaning can make better defaults and can avoid some obvious traps.
This does not solve every visualization problem. Semantic types can be wrong. Field names can be misleading. A column called
That is why human editability is not a side feature. Microsoft Research’s source material stresses simple, human-editable specifications because the user still needs to inspect the agent’s assumptions. The best version of Flint is not one where people stop thinking about charts. It is one where people spend less time on layout plumbing and more time on whether the chart expresses the right analytical claim.
It is not enough to declare the problem solved. LLM-judge scores measure one version of quality under one evaluation setup. Production visualization quality includes things that are harder to compress into a single number: whether users draw correct conclusions, whether charts remain readable under changing data, whether accessibility needs are met, whether teams can review and maintain specs, and whether generated charts behave predictably across backends.
There is also the question of how Flint handles disagreement between human intent and compiler defaults. Automatic layout and formatting are excellent when they match expectations. They are frustrating when they do not. Expert users will need escape hatches, and teams will need conventions for when to accept compiler choices versus when to override them.
Microsoft’s source material does not detail every override mechanism or governance pattern, so the responsible reading is to treat Flint as a promising layer rather than a finished answer to visualization correctness. Its strongest contribution is architectural: separate intent from rendering, make semantics explicit, and let a compiler manage the repetitive low-level decisions. That architecture is sensible even if individual implementations evolve.
The real test will be sustained use in tools like Data Formulator and agent-connected environments. If users can repeatedly ask for charts, refine them, inspect the specs, and trust the results, Flint’s abstraction will have earned its place. If they constantly have to fight the compiler or correct semantic guesses, it will become another layer to debug.
That is the right question. Language models are good at mapping vague human requests into structured intent. They are less dependable as the sole authority over every technical detail in a specialized output format. A visualization compiler, like a database optimizer or a type checker, can provide constraints and consistency that a model alone cannot guarantee.
Flint’s use of Model Context Protocol reinforces that trend. The agent is not just a text generator; it is a coordinator calling tools. The chart is not just emitted as static code; it can be created, validated, rendered, and inspected. This is the direction serious AI workflows are moving: tools with narrow competence, connected through agents that understand user goals.
For Microsoft Research, the strategic implication is clear. If AI is going to permeate data work, Microsoft needs abstractions that make generated artifacts reliable enough for professionals. Flint is one such abstraction. It does not replace Vega-Lite, Apache ECharts, or Chart.js; it tries to make them more accessible to agents and more maintainable for humans.
For the broader ecosystem, Flint raises a useful challenge. The future of AI-assisted visualization may not belong to the model that can generate the longest chart spec. It may belong to the system that asks the model for the least brittle representation of intent and then compiles that intent carefully.
The timing matters because AI-assisted data analysis is moving from demo-land into everyday workflows: chat windows, coding environments, notebooks, internal dashboards, and analyst copilots. In that world, a chart is not just decoration at the end of an answer. It is often the answer’s evidence, and if the chart silently mishandles dates, scales, baselines, labels, density, or color, the user may trust a conclusion that the visualization itself has distorted.
 Flint Treats the Chart Spec as the Weak Link
The most useful way to understand Flint is to stop thinking of it as another charting library. Microsoft Research describes it as a visualization intermediate language, which places it between human or agent intent on one side and rendering libraries on the other. That is a deliberate architectural choice: instead of making the model produce a full Vega-Lite, Apache ECharts, or Chart.js specification directly, Flint asks for a smaller expression of what the chart is supposed to mean.That distinction is the heart of the project. Modern visualization systems already expose enormous control over axes, scales, formatting, spacing, colors, aggregation, legends, and layout. The problem, as Microsoft’s source material frames it, is that these controls create a trade-off: short specs that rely on defaults are often dull or wrong in subtle ways, while polished visualizations require verbose, fragile parameters that are easy for both people and agents to get wrong.
This is a familiar pattern in software. Developers do not generally want to hand-write assembly when a compiler can reason from higher-level intent. Web authors do not want to specify every glyph position when a layout engine can calculate flow. Flint applies the same argument to visualization: if the system understands the semantic role of the data and the intended chart mapping, it can derive much of the low-level machinery.
That matters more for AI agents than it does for expert human chart authors. A skilled visualization engineer may know when a scale should begin at zero, how to format a year-month field, or when a diverging color scale is appropriate. A language model may guess convincingly, especially when the output is syntactically valid. Flint’s bet is that making the model express meaning rather than low-level rendering mechanics gives the compiler the part of the job it is better suited to perform.
Semantic Types Are the Real Product
Microsoft Research’s source material repeatedly emphasizes semantic data types, and that emphasis is not cosmetic. Flint leverages semantic data types to express the meanings of data, with examples includingYearMonth and Profit. In the heatmap example described by Microsoft, the Flint specification names period as YearMonth and newUsers as Profit, then maps fields to visual channels.That is more than metadata decoration. If a compiler knows a field is a year-month value, it can make different choices than it would for a generic string. It can parse temporal values, format axes appropriately, and avoid treating months as arbitrary categories. If it knows a measure behaves like profit, it can choose formatting, baselines, and color schemes that better match the semantics of positive and negative values.
This is where Flint diverges from the usual “AI writes chart code” pitch. The project is not asking the model to be a perfect visualization specialist. It is asking the model to identify a smaller and arguably more natural set of facts: this field is a date-like period, this field is a measure, this value has financial meaning, this chart should map one field to color and another to an axis.
Microsoft Research argues that semantic types are often easier for language models to infer than a complete set of low-level visualization parameters. That is plausible because field names, value patterns, and common domain knowledge often reveal meaning before they reveal optimal rendering settings. A column named
period containing year-month values has a recognizable role; knowing exactly how a Vega-Lite spec should express temporal parsing and axis formatting is a more specialized task.The practical consequence is important for Windows users and developers working inside AI-assisted tooling. If chart generation becomes part of chat and coding workflows, users need output that is inspectable. A compact Flint spec that says what a field means is far easier to review than a dense backend-native specification stuffed with layout, scale, and formatting decisions. The human can challenge the semantic claim — “is this really profit?” — without reverse-engineering every rendering parameter.
The Compiler, Not the Prompt, Does the Polishing
The old way to get better AI charts is to write better prompts. Tell the model to use readable labels. Tell it to make the chart polished. Tell it to choose good colors. Tell it not to let axis labels overlap. This works until it does not, because prompting remains advisory while the output specification remains a pile of low-level decisions generated by a probabilistic system.Flint moves that work into a compiler. According to Microsoft Research, the Flint compiler derives optimized chart settings from the data, semantic types, chart type, and encodings. It can manage parsing rules, scales, axes, aggregations, formatting, color schemes, layout, and backend-native specification generation. The user does not have to explicitly configure every fragile detail.
That compiler-centered design is the project’s strongest claim. Flint automatically manages sizing, spacing, labels, and layout so charts remain readable as cardinality and density change, without explicit user configurations. In plain English: the chart should not fall apart just because the number of categories grows, labels get longer, or the data becomes denser.
This is one of the areas where AI chart demos often look better than AI chart workflows. A single carefully selected dataset can produce a nice screenshot. A production analysis environment has changing data, edge cases, and users who ask follow-up questions. If every change requires the agent to rewrite low-level layout logic, the system becomes fragile. If the compiler can adapt layout from the higher-level chart intent, the same specification has a better chance of surviving real data.
Microsoft’s heatmap example captures the point neatly. A high-quality heatmap requires decisions about processing the period field, labeling year-month values, sizing cells, and choosing a color scale that represents positive and negative values appropriately. Without those decisions, a rendering library may still produce a technically valid chart, but technical validity is a low bar. A misleading chart can be syntactically perfect.
The phrase “technically valid but potentially misleading” is the quiet warning underneath the whole project. AI systems are already good at producing artifacts that look finished. The danger is that a chart can look authoritative while embedding bad assumptions. Flint’s answer is not to make the language model more verbose; it is to make the specification less about rendering trivia and more about chart semantics.
One Intent, Three Rendering Worlds
Flint’s multi-backend story is not just a convenience feature. Microsoft Research says a single Flint specification can compile to Vega-Lite, Apache ECharts, or Chart.js. That means Flint is trying to preserve chart intent separately from any one rendering library’s API and programming model.For developers, that separation is attractive because charting-library choices are rarely permanent. A team may prototype with one system, embed interactive visualizations with another, and standardize production dashboards around a third. If the chart’s meaning is trapped inside a backend-native specification, moving it can mean rewriting more than just syntax. It can mean rediscovering every design decision encoded in the original.
Flint’s intermediate representation gives Microsoft a cleaner story for agentic workflows. The agent can generate a compact Flint specification, validate it, render it, and potentially compile it into whichever backend the environment requires. The system does not have to ask the model to become simultaneously fluent in Vega-Lite, Apache ECharts, and Chart.js internals every time a user asks for a chart.
This also changes the failure mode. If a model directly emits a complex Vega-Lite spec and the result is wrong, the user must decide whether the problem is the data mapping, the Vega-Lite syntax, the scale configuration, the labels, the aggregation, or the prompt. If the model emits Flint and the compiler emits the backend-native spec, debugging can move up a level. The human can inspect the intent, while the system owns the translation.
There is a catch, of course. Any intermediate language has to justify its abstraction. If it hides too much, experts will fight it. If it exposes too much, agents will struggle with it. Microsoft Research’s pitch is that Flint’s specification is compact and human-editable while still expressive enough to generate polished charts. That balance will determine whether Flint becomes a useful layer or just another format in an already crowded visualization stack.
The DirectVL Comparison Shows a Modest but Consistent Edge
Microsoft Research compared Flint with DirectVL, a baseline that asks the model to directly generate full, more complex Vega-Lite specifications in a large-language-model self-evaluation pipeline. The study used testing data from Tidy Tuesdays and evaluated three tested models: GPT-5.1, GPT-5-mini, and GPT-4.1. Across all three, Flint received higher overall LLM-judge scores.| Tested model | Flint LLM-judge score | DirectVL LLM-judge score | Reported advantage |
|---|---|---|---|
| GPT-5.1 | 16.27 | 15.91 | Flint higher |
| GPT-5-mini | 16.16 | 15.60 | Flint higher |
| GPT-4.1 | 15.91 | 15.34 | Flint higher |
That is exactly the kind of result an intermediate language needs. If Flint only helped weak models, it might be a temporary crutch. If it only helped the strongest model, it might be a benchmark artifact. The reported results instead support a narrower but more durable claim: when models are asked to generate chart intent in Flint rather than full Vega-Lite directly, the resulting charts score better in Microsoft’s LLM-judge evaluation.
Still, the evaluation should be read carefully. The source material says the comparison used an LLM self-evaluation pipeline, which means the judge itself is model-mediated. That does not make the result meaningless, but it does mean the score is not the same thing as a large blind human study of chart comprehension, accessibility, and analytical correctness. A stronger future case for Flint would pair automated judging with human evaluation and real-world task success.
Even so, the baseline choice is revealing. DirectVL represents the straightforward way many AI chart systems are built: ask the model to output the final spec. Flint’s win is an argument against that direct-generation approach. The more complex the target format, the more likely the model is to spend its effort on syntactic and library-specific detail rather than the user’s analytical intent.
Data Formulator Makes This More Than a Research Toy
Microsoft Research says Flint is now used to power Data Formulator, a Microsoft Research project for AI-assisted data analysis and visualization. That matters because it moves Flint from “interesting language design” toward “infrastructure being used by a real research product.” It is not just a paper concept or a GitHub curiosity in the provided source material; it is already part of Microsoft’s own AI-assisted visualization stack.Data Formulator is a fitting host because AI-assisted data analysis is where chart generation gets messy fastest. Users do not merely ask for a chart once. They ask to group, filter, transform, compare, explain, and refine. Each follow-up can change the data shape, the intended comparison, and the density of the display. A chart spec that was adequate for the first answer may become awkward or wrong three turns later.
That is where Flint’s layout and semantic claims become operationally important. If the system can carry forward chart intent and recompile it as the data changes, an agent can support iterative analysis without constantly rebuilding fragile backend specs. The user can remain in the analytical conversation instead of becoming an unwilling visualization debugger.
The connection to Data Formulator also hints at a broader Microsoft Research strategy. The company is not only building models or adding chat boxes to existing tools. It is creating intermediate structures that make AI outputs more reliable inside specialized domains. In that reading, Flint is part of a wider shift from “let the model do everything” to “let the model express intent, then let domain systems enforce structure.”
That shift is welcome. Large language models are powerful, but they are not compilers, layout engines, visualization grammars, or statistical validators. The best AI-assisted tools increasingly look like hybrids: the model interprets the user, proposes a plan, and fills in high-level structure; deterministic software handles the parts where precision, consistency, and repeatability matter. Flint is a clean example of that hybrid architecture.
The MCP Server Is the Agent Story
The open-source project includes theflint-chart library and the flint-chart-mcp server. Microsoft describes flint-chart-mcp as a Model Context Protocol server that allows agents to create, validate, and render charts inside a chat or coding environment. That is the part of the announcement aimed directly at the current agent ecosystem.MCP matters because it gives AI clients a standardized way to call tools. In Flint’s case, those calls can embed data inline or read configured local files, and the server can open an interactive chart view. That means an agent can move beyond describing a chart in prose or dumping code into a message. It can ask a charting tool to validate and render the result where the user is already working.
For Windows developers and IT pros, this is the part to watch. AI coding environments are quickly becoming places where analysis happens, not just places where code is written. A developer investigating telemetry, a support engineer looking at incident data, or an administrator reviewing inventory can plausibly ask an agent to visualize a local dataset. Flint’s MCP server gives that workflow a more structured path than “generate some JavaScript and hope it runs.”
The local-file capability is useful but also operationally sensitive. If MCP calls can read configured local files, administrators need to understand what files are configured, which clients can invoke the server, and whether rendered charts could expose sensitive data. The source material does not describe a security model, so it would be irresponsible to infer one. The practical guidance is simpler: treat an agent-connected visualization server as a tool with data access, not as a harmless UI widget.
This is also why validation is central. An agent that can create, validate, and render charts has a tighter feedback loop than an agent that merely writes a spec. It can find errors earlier, show the user an interactive result, and support refinement. In the best case, the user reviews a chart instead of a block of code; in the safer case, the system makes the generated artifact inspectable before anyone relies on it.
Action checklist for admins
- Inventory any AI clients or coding environments where
flint-chart-mcpis enabled. - Restrict configured local-file access to approved data directories rather than broad user or project roots.
- Validate whether generated charts may expose sensitive fields before enabling agent-driven rendering for shared environments.
- Standardize which backend targets — Vega-Lite, Apache ECharts, or Chart.js — are acceptable for production workflows.
- Encourage users to review semantic type assignments, especially for dates, financial values, percentages, rankings, and measures with positive/negative meaning.
- Treat Flint specs as reviewable artifacts when charts are used in reports, dashboards, or incident analysis.
The Open-Source Move Is About Trust as Much as Adoption
Microsoft Research says Flint is open source and includes both theflint-chart library and the MCP server. Open source is important here because visualization systems sit in the path between data and decision. If a compiler is automatically choosing scales, baselines, formatting, color schemes, and layout, users need a way to inspect and challenge those choices.A closed black box that “makes charts better” would be hard to trust in serious analytical settings. The whole point of Flint is that low-level decisions are derived from semantics and encodings. Developers and visualization experts will want to know how those derivations work, where the defaults come from, and how the compiler behaves in edge cases.
The open-source component also creates the possibility of backend-specific scrutiny. Vega-Lite, Apache ECharts, and Chart.js do not have identical models. They differ in grammar, rendering behavior, interactivity, ecosystem expectations, and the kinds of charts developers commonly build with them. A single intermediate specification that targets all three must make translation choices, and those choices deserve review.
This is where community adoption could improve the project. Visualization is full of domain-specific expectations: finance charts, scientific plots, operational dashboards, accessibility requirements, localization, and reporting conventions all impose different demands. If Flint is going to become a serious semantic layer, it will need pressure from users who care about more than a polished demo.
The danger is that “visually polished” becomes a proxy for “good.” A chart can look refined and still be analytically poor. It can use attractive colors while choosing a questionable baseline. It can avoid label overlap while emphasizing the wrong comparison. Flint’s semantic approach helps, but it does not eliminate the need for judgment. Open source at least gives practitioners a place to examine the judgment being encoded.
Why This Matters for Windows Workflows
WindowsForum readers should care about Flint not because it changes Windows itself, but because it reflects where Microsoft-adjacent tooling is going. AI-assisted work is becoming embedded in developer environments, analysis tools, enterprise workflows, and chat-based interfaces. Charts are one of the first places where those systems can appear useful while still being quietly wrong.In Windows environments, the likely early adopters are not casual users building one-off graphics. They are developers, analysts, administrators, and support teams using AI clients to understand structured data. That could mean logs, tickets, financial exports, telemetry, asset inventories, performance data, security findings, or product metrics. In each case, a chart can compress complexity — and in each case, a bad chart can compress it badly.
Flint’s promise is that the agent does not have to become an expert in every rendering library before producing something useful. A support engineer should be able to ask for a heatmap of incident volume by month and category without needing to specify temporal parsing rules, cell sizing, legend configuration, and label spacing. A developer should be able to iterate on a visualization without watching the model bloat a backend spec into something nobody wants to maintain.
The same logic applies to education and documentation. If AI assistants are going to generate charts inside tutorials, code samples, or internal knowledge bases, a compact human-editable spec is easier to review than backend-native boilerplate. It can be stored, diffed, discussed, and corrected. That makes the chart artifact less magical and more like a normal part of the software workflow.
But the Windows enterprise angle also brings risk. Agent tools that read local files and render data need governance. Even if Flint itself is just a visualization layer, it may be invoked inside environments with sensitive data. The more seamless the workflow becomes, the more important it is to define boundaries before the first executive dashboard or incident report depends on an agent-generated chart.
The Hard Problem Is Not Syntax but Meaning
The source material frames visualization libraries as powerful but demanding, and that framing is correct. Vega-Lite, Apache ECharts, and Chart.js already let users build serious charts. The bottleneck is not that these libraries lack features. The bottleneck is translating messy human intent and messy data into the right combination of visual encodings and design decisions.AI agents seem like an answer because they are good at interpreting human requests. But direct generation pushes them into a role they are less reliable at: producing long, precise, low-level specifications in a target library’s format. The more parameters the model must juggle, the more places there are for small errors to become visual lies.
Flint’s most interesting contribution is the claim that meaning should be first-class. The chart spec should not merely say “put this field on x and that field on y.” It should help the compiler understand what those fields are. Dates, prices, percentages, countries, rankings, correlations, and profits carry expectations. A system that knows the meaning can make better defaults and can avoid some obvious traps.
This does not solve every visualization problem. Semantic types can be wrong. Field names can be misleading. A column called
profit might contain projected profit, margin, delta, or something else entirely. A YearMonth field may need fiscal-year handling that generic temporal parsing does not capture. Flint reduces one class of brittleness, but it does not abolish domain ambiguity.That is why human editability is not a side feature. Microsoft Research’s source material stresses simple, human-editable specifications because the user still needs to inspect the agent’s assumptions. The best version of Flint is not one where people stop thinking about charts. It is one where people spend less time on layout plumbing and more time on whether the chart expresses the right analytical claim.
The Benchmark Win Is Useful, but the Operational Test Comes Later
The reported LLM-judge results give Flint a credible starting point. Across GPT-5.1, GPT-5-mini, and GPT-4.1, Flint outperformed DirectVL on overall scores in Microsoft Research’s comparison using Tidy Tuesdays testing data. That is enough to take the approach seriously.It is not enough to declare the problem solved. LLM-judge scores measure one version of quality under one evaluation setup. Production visualization quality includes things that are harder to compress into a single number: whether users draw correct conclusions, whether charts remain readable under changing data, whether accessibility needs are met, whether teams can review and maintain specs, and whether generated charts behave predictably across backends.
There is also the question of how Flint handles disagreement between human intent and compiler defaults. Automatic layout and formatting are excellent when they match expectations. They are frustrating when they do not. Expert users will need escape hatches, and teams will need conventions for when to accept compiler choices versus when to override them.
Microsoft’s source material does not detail every override mechanism or governance pattern, so the responsible reading is to treat Flint as a promising layer rather than a finished answer to visualization correctness. Its strongest contribution is architectural: separate intent from rendering, make semantics explicit, and let a compiler manage the repetitive low-level decisions. That architecture is sensible even if individual implementations evolve.
The real test will be sustained use in tools like Data Formulator and agent-connected environments. If users can repeatedly ask for charts, refine them, inspect the specs, and trust the results, Flint’s abstraction will have earned its place. If they constantly have to fight the compiler or correct semantic guesses, it will become another layer to debug.
What Flint Says About the Next Phase of AI Tools
Flint is part of a larger correction in AI product design. The first wave of generative AI tools often celebrated direct output: ask for code, get code; ask for a chart, get a chart; ask for a document, get a document. The second wave is more sober. It asks where the model should stop and where structured systems should take over.That is the right question. Language models are good at mapping vague human requests into structured intent. They are less dependable as the sole authority over every technical detail in a specialized output format. A visualization compiler, like a database optimizer or a type checker, can provide constraints and consistency that a model alone cannot guarantee.
Flint’s use of Model Context Protocol reinforces that trend. The agent is not just a text generator; it is a coordinator calling tools. The chart is not just emitted as static code; it can be created, validated, rendered, and inspected. This is the direction serious AI workflows are moving: tools with narrow competence, connected through agents that understand user goals.
For Microsoft Research, the strategic implication is clear. If AI is going to permeate data work, Microsoft needs abstractions that make generated artifacts reliable enough for professionals. Flint is one such abstraction. It does not replace Vega-Lite, Apache ECharts, or Chart.js; it tries to make them more accessible to agents and more maintainable for humans.
For the broader ecosystem, Flint raises a useful challenge. The future of AI-assisted visualization may not belong to the model that can generate the longest chart spec. It may belong to the system that asks the model for the least brittle representation of intent and then compiles that intent carefully.
The Signal Hidden in the Small Spec
The practical story is compact: Microsoft Research is trying to make AI-generated charts less fragile by moving low-level visualization decisions out of the model’s prompt response and into a semantic compiler. For teams evaluating Flint, the question is not whether it can produce a prettier chart in a demo. The question is whether it makes chart generation more reviewable, repeatable, and safe inside real workflows.- Flint is a visualization intermediate language, not a replacement rendering engine.
- Its core idea is semantic typing: fields such as
YearMonthandProfitguide compiler decisions. - One Flint specification can target Vega-Lite, Apache ECharts, or Chart.js.
- Microsoft Research reports higher LLM-judge scores for Flint than DirectVL across GPT-5.1, GPT-5-mini, and GPT-4.1.
- The open-source package includes
flint-chartandflint-chart-mcpfor agent workflows. - Admins should treat MCP-enabled chart generation as a data-access workflow, especially when local files are configured.
References
- Primary source: Microsoft
Published: 2026-07-08T16:10:08.412872
Flint: A visualization language for the AI era - Microsoft Research
Short chart specifications are easy to write, but often produce uninspiring results. Flint is an open-source visualization language that offers a middle path, letting AI agents create expressive charts from compact, human-editable specifications.www.microsoft.com
