

HWiNFO 8.50, released on July 8, 2026, adds MSI Claw 8 fan-speed monitoring, improves Intel Nova Lake support, updates Intel PresentMon, and expands NVIDIA GPU telemetry with measured core, memory, and XBAR clocks for Windows users who live inside sensor panels. The update is not glamorous in the way a new GPU driver or Windows feature release is glamorous. It is more important than that for a certain kind of user: the person trying to understand what a modern PC is actually doing when firmware, drivers, silicon telemetry, and vendor utilities all disagree. HWiNFO 8.50 is a reminder that the Windows performance stack is only as useful as the instruments attached to it.
HWiNFO has released version 8.50 of its hardware information and sensor monitoring software, and the headline changes are classic HWiNFO: fewer marketing claims, more raw visibility. Per HWiNFO’s own version history, this release adds fan speed monitoring on MSI Claw 8, improves Intel Nova Lake support, enhances sensor monitoring on Maxsun 275HX series systems, updates Intel PresentMon, and adds measured NVIDIA GPU core, memory, and XBAR clock monitoring.
That sounds like a maintenance release until you place it in the context of the current Windows hardware market. Handheld gaming PCs are behaving more like laptops, laptops are behaving more like consoles, desktop GPUs are behaving more like power-managed workstation devices, and Windows is expected to make all of it look coherent. HWiNFO’s job is not to make those layers simple. Its job is to expose enough of the system that a user can make an informed decision.
The practical result is a version that matters to gamers, overclockers, reviewers, support desks, and admins who use HWiNFO as a sanity check when OEM dashboards, Windows counters, BIOS pages, and vendor control panels tell different versions of the same story. This is not a control update; it is an observability update. That distinction matters.
Handheld gaming PCs compress a Windows laptop’s thermal problem into a console-shaped enclosure. The CPU, graphics, memory, storage, battery, display, and cooling system all compete inside a chassis that users hold in their hands. When performance drops, fan noise spikes, or frame pacing becomes erratic, the user needs to know whether the device is heat-soaked, power-limited, firmware-governed, or simply behaving normally under its current profile.
That is where HWiNFO’s Claw 8 fan support matters. It does not magically improve cooling. It does not grant fan-curve control. It does not promise that every Claw-related thermal complaint has one obvious answer. What it does is bring one more previously opaque data point into the same sensor view as CPU temperature, GPU behavior, power readings, clocks, and logging.
For MSI Claw 8 owners who already build overlays using HWiNFO and tools such as RivaTuner Statistics Server, a fan-speed reading is especially useful. A temperature overlay without fan context can mislead. A high temperature with low fan speed suggests a different troubleshooting path than a high temperature with a high fan reading. A fan-speed change that does not correspond to a visible temperature increase may also be useful evidence when comparing behavior across power modes, BIOS versions, or workloads.
The important boundary is that HWiNFO’s changelog describes monitoring support. It does not claim fan control. It does not specify a broader compatibility matrix beyond MSI Claw 8. It does not say that all related handheld variants expose identical sensors. Users should treat the new readout as monitoring support, not as evidence that every thermal behavior can now be modified or overridden.
The word “measured” is doing the work here, but it should not be overread. GPU monitoring has always included clock values that can describe different things: driver-reported clocks, effective behavior, domain clocks, boost states, memory rates, and other values exposed through hardware and software telemetry paths. HWiNFO 8.50 adds another set of readings for users who want more detail than a single generic GPU clock line.
Core clock and memory clock are familiar to most enthusiasts. XBAR is less consumer-facing, but it belongs to the same larger point: modern GPUs are not one simple clock domain. They contain multiple internal domains, and monitoring tools increasingly expose more of that detail. For reviewers, overclockers, and users comparing logs, having measured core, memory, and XBAR clock fields may make a sensor capture more complete.
The release notes do not specify whether the new measured NVIDIA readings require a particular GPU architecture, driver branch, firmware implementation, or configuration. That absence should keep expectations realistic. Some users may see the new sensors immediately. Others may not, depending on the GPU, driver, firmware, permissions, or how the NVIDIA telemetry path is exposed to third-party software.
More sensors also mean more opportunities for misinterpretation. A measured XBAR clock appearing lower or different than expected does not automatically indicate a fault. A measured memory clock line should not be treated as a complete diagnosis of memory performance. A measured core clock value should be interpreted alongside workload, utilization, power, temperature, and time. HWiNFO is giving users more evidence, not a universal diagnosis.
The practical advice is simple: if you use HWiNFO for NVIDIA GPU logging, add the new measured clock fields to your view, capture a few baseline runs, and compare them with your existing sensor set before changing any performance assumptions. The new values are useful because they add context. They are not a reason to discard the rest of the log.
Processor support is not merely a matter of putting a name in a summary window. A monitoring tool has to identify platform characteristics, expose available sensors, and report hardware information in a way that makes sense to the user. Early and improved support can be incremental, especially when firmware and platform behavior continue to mature.
The Nova Lake line should be read narrowly. HWiNFO 8.50 improves Intel Nova Lake support. It does not reveal Nova Lake specifications. It does not establish a launch date. It does not prove retail readiness. It does not mean every sensor on every future Nova Lake system is final or complete. It is better understood as platform-support work inside the monitoring layer.
For WindowsForum readers, the practical lesson is straightforward. If you work with early hardware, review samples, OEM systems, validation benches, or enthusiast builds around new Intel platforms, monitoring tool version matters. An old HWiNFO build may launch and show familiar fields, but that does not mean it understands the platform well enough for serious diagnosis.
This is one reason IT pros and reviewers should be cautious about copying sensor interpretations from one CPU generation to the next. A temperature label, power reading, or clock domain name can look familiar while being implemented differently on newer hardware. HWiNFO 8.50’s improved Nova Lake support is an incremental step in keeping the tool aligned with Intel’s upcoming platform work.
HWiNFO’s integration of PresentMon gives users a way to connect performance telemetry with the broader sensor environment. That is important because a frame-time spike by itself is only a symptom. A spike aligned with a GPU clock change, CPU package power change, fan-speed change, temperature plateau, or background load is closer to a useful troubleshooting record.
The release notes do not specify which PresentMon changes are included in this update, so the safe reading is simply that HWiNFO has refreshed its integrated PresentMon component. That is still useful. PresentMon is part of the chain that lets Windows gamers move from “this feels bad” to “this frame pacing event coincided with these hardware conditions.”
That chain is becoming more valuable as handhelds, laptops, and desktops all adopt more aggressive power management. On a desktop with a large cooler and high power budget, a performance anomaly may be easier to isolate. On a handheld or thin laptop, the system may be balancing frame output, package power, fan behavior, surface temperature targets, battery drain, and background Windows activity at the same time. The frame is the user-visible output of that negotiation.
HWiNFO 8.50 does not turn PresentMon into a one-click answer machine. It does, however, keep HWiNFO aligned with the performance-analysis workflow used by many reviewers and enthusiasts. The best troubleshooting sessions increasingly combine three views: what the user saw, what the frame-time data recorded, and what the hardware sensors were doing at the same moment.
Those are not the lines that drive broad attention, but they are part of why HWiNFO remains useful in the Windows ecosystem. PC hardware is not standardized in the way buyers often imagine. Motherboard vendors expose sensors differently. Cooling ecosystems depend on USB controllers, firmware protocols, and vendor utilities. ACPI tables describe platform capabilities in ways that can affect power and device behavior. Display audio capability information can matter when debugging monitor, GPU, and audio-path issues.
Maxsun 275HX support is a good example. A user with one of those systems does not care whether the improvement is globally exciting. They care whether board-specific telemetry appears accurately enough to troubleshoot a real machine. For builders and support communities, that is where tool credibility is earned: not in universal features, but in the specific sensor that finally appears where it should.
Corsair Link support sits in the same category. Many enthusiast PCs are now miniature ecosystems of controllers, coolers, hubs, lighting devices, and monitoring interfaces. When the monitoring layer fails to see a device, the user may not know whether the device is faulty, the USB path is unstable, the vendor utility is interfering, or the third-party tool lacks support. Improved Corsair Link device support reduces one source of ambiguity.
ACPI version reporting is even more diagnostic than decorative. ACPI is one of the deeper layers through which firmware describes hardware and power-management behavior to the operating system. Most users will never need to know the ACPI version surfaced by HWiNFO. But when debugging firmware oddities, sleep behavior, device enumeration, or platform reporting differences across BIOS versions, having that detail in the report can save time.
Display Audio monitor capability information is similarly specialized. It may help in cases where a GPU-connected monitor’s audio capabilities or display path behavior need to be understood. Again, this is not a feature that changes a gaming benchmark. It is a feature that can make a support thread shorter.
Custom sensors matter because HWiNFO is often not used alone. Enthusiasts build dashboards around it. Admins may log selected readings. Reviewers may define views that match a test method. Users may publish sensors into shared memory for overlays or other tools. Losing custom sensors is not cosmetic when your monitoring setup depends on them.
WHEA sensors matter because Windows Hardware Error Architecture data can be an early warning sign for instability. Users chasing memory errors, PCIe problems, marginal overclocks, undervolts, power delivery issues, or platform instability often watch WHEA-related reporting carefully. If those sensors disappear, an unstable system can look cleaner than it is.
The AMD Radeon RX 6500XT recognition fix is a narrower but still meaningful correction. Misrecognition undermines confidence in every other reading. If a tool identifies a GPU incorrectly, a user has to wonder what else is wrong: power limits, clocks, memory configuration, driver path, or feature detection. Correct naming is the first layer of trust.
The long sensor-name crash fix is the kind of bug that sounds minor until it hits a production logging box, a reviewer’s test bench, or a user’s carefully assembled overlay. Sensor ecosystems are sprawling. Device names, vendor labels, firmware strings, and custom labels can become unexpectedly long. A monitoring tool should degrade gracefully when names are ugly. HWiNFO 8.50’s fix suggests one more edge case has been closed.
Overlay readability matters. A sensor value that cannot be read against a bright game scene might as well not exist. A background color option helps users tune contrast without changing the rest of their monitoring stack. It also helps standardize screenshots and videos, which matters when people are comparing behavior across systems.
This becomes especially relevant for handhelds. A desktop user can glance at a second monitor. A handheld user often has one small screen, a game, an overlay, and a limited amount of visual space. If HWiNFO is going to be part of the handheld troubleshooting toolkit, its OSD needs to be legible without becoming intrusive.
There is also a content-creation angle. Reviewers and technically minded creators frequently rely on overlays to show power, temperature, utilization, clocks, and frame pacing in real time. A more readable OSD reduces ambiguity for the audience. The color of a background box is not the story; the ability to see the sensor clearly during a transient performance event is.
First, if you own or support an MSI Claw 8, open the HWiNFO Sensors window and look for the newly available fan-speed reading. Confirm that fan RPM appears during idle and under load, then start a short logging session while launching a game, benchmark, or repeatable workload. Save that log as a baseline. The key is not to assume the number proves anything by itself, but to confirm that the fan reading is visible and can be recorded alongside temperature, clocks, and power data.
Second, re-check Custom and WHEA sensors. If your previous HWiNFO setup used custom sensor labels, custom groups, shared-memory feeds, or WHEA-related readings, verify that those entries still appear after the update. Open the Sensors window, expand the relevant Custom and WHEA sections, and confirm that your overlay or logging profile still includes the fields you expect. If you maintain repeatable test templates, run a short log and confirm the resulting CSV includes the same Custom and WHEA columns you rely on.
Third, on NVIDIA GPU systems, look for the new measured core, memory, and XBAR clock fields. Add them to your sensor layout or logging profile, but do not immediately replace older clock fields in your process. For the first few runs, log both the existing GPU clock readings and the new measured readings so you can see how they differ on your system. That before-and-after comparison is more useful than treating any one field as automatically authoritative.
Fourth, if you use an on-screen display, verify overlay visibility after the update. Check whether the new OSD background color option improves readability in the actual games, benchmarks, or workloads where you use it. Do not judge the overlay only on the desktop. Test it against a bright scene, a dark scene, and a fast-moving scene. If you record footage or share troubleshooting clips, make sure the sensor text remains legible after compression.
Finally, if your system includes Corsair Link devices, a Maxsun 275HX series platform, a Radeon RX 6500XT, or display audio configurations that you previously had to inspect manually, open the relevant HWiNFO hardware and sensor views after updating. Confirm that the device names, sensor groups, and capability information look sensible before using the tool as evidence in a support thread or validation report.
A fan speed reading on MSI Claw 8 does not by itself prove that a fan curve is good or bad. A measured NVIDIA memory clock does not by itself prove a memory bottleneck. An XBAR clock reading does not by itself explain a frame-time spike. An ACPI version does not by itself diagnose a firmware bug. These values become useful when they are correlated with workload, time, temperature, power, errors, and reproducible behavior.
That is the discipline HWiNFO rewards. The tool is strongest when users log data over time, compare before-and-after conditions, and resist the urge to treat every unfamiliar sensor as a crisis. A single screenshot can start a conversation, but a log file usually tells the truth.
This is especially important for WHEA monitoring. Seeing WHEA-related information vanish because of a bug is bad. Seeing WHEA information return is good. But interpreting hardware errors requires care. Some errors are catastrophic, some are corrected, some are platform-specific, and some appear only under certain combinations of firmware, drivers, memory settings, or power states. HWiNFO can surface the signal. It cannot replace judgment.
The same applies to NVIDIA measured clocks. Enthusiasts often want one number that explains performance. Modern GPUs rarely oblige. Clock behavior is shaped by workload, voltage, power, temperature, driver policy, silicon quality, and application behavior. HWiNFO 8.50 adds more pieces of that behavior to the display. It does not make the system simple.
The Claw 8 addition is consumer-facing, but the principle applies broadly. Mobile and compact Windows systems increasingly hide thermal and power behavior behind vendor utilities. When users complain about performance, heat, fan noise, or battery drain, support teams need evidence. Without third-party telemetry, the answer often becomes a cycle of BIOS updates, driver reinstalls, Windows resets, and guesswork.
The Nova Lake support matters to organizations that evaluate new client platforms early. IT teams do not need to wait for a platform to become mainstream before they start caring about its telemetry. If a new CPU generation changes power behavior or sensor reporting, support playbooks need to evolve before deployment.
The PresentMon update matters for any organization supporting graphics-heavy workloads. That includes game studios, visualization teams, CAD users, video production, simulation environments, and test labs. When a user reports “lag,” “stutter,” or “slow rendering,” frame-pacing data tied to system telemetry is more useful than average utilization alone.
The bug fixes matter because monitoring reliability is part of operational reliability. A tool that loses custom sensors can break a repeatable test method. A tool that loses WHEA sensors can hide instability signals. A tool that crashes on an unusually long sensor name can interrupt logging at exactly the wrong time.
Users tend to notice monitoring tools only when they are wrong. A missing fan sensor becomes visible when a handheld gets loud. A missing WHEA sensor becomes visible when an overclock looks stable until it does not. A GPU misrecognition becomes visible when a support thread starts with the wrong hardware. A crash caused by a long sensor name becomes visible when logging stops during the test that mattered.
HWiNFO 8.50 addresses several of those failure points. It adds MSI Claw 8 fan monitoring for handheld owners. It improves Intel Nova Lake support for future-facing platform coverage. It enhances Maxsun 275HX sensor monitoring for users on that hardware. It updates Intel PresentMon for frame-analysis workflows. It adds measured NVIDIA core, memory, and XBAR clock monitoring for more detailed GPU telemetry. It fixes lost Custom and WHEA sensors. It adds ACPI version reporting, improves Corsair Link support, adds Display Audio monitor capability information, adds an OSD background color option, fixes Radeon RX 6500XT recognition, and resolves a possible crash caused by an overly long sensor name.
That collection is not flashy, but it is coherent. The update makes HWiNFO better at seeing the system, better at staying stable while seeing it, and better at presenting the information users need while Windows hardware keeps getting more complicated.
For enthusiasts, that means better overlays and better logs. For reviewers, it means more complete test captures. For support communities, it means fewer blind spots. For admins, it means another reason to treat monitoring-tool versions as part of the diagnostic environment rather than an afterthought.
The best way to read HWiNFO 8.50 is not as a feature drop, but as calibration. The Windows PC is still becoming more heterogeneous, more power-managed, more firmware-dependent, and more difficult to summarize with one dashboard. HWiNFO’s value is that it keeps chasing the details. In this release, those details happen to include a handheld fan, a future Intel platform, new NVIDIA measured clock fields, refreshed PresentMon integration, device-support refinements, and sensor fixes that protect the reliability of existing workflows.
That is enough to make HWiNFO 8.50 worth the update for anyone who uses the tool as more than a curiosity. If your troubleshooting process depends on what the Sensors window says, this is the kind of release you install, verify, and baseline before the next mystery starts.
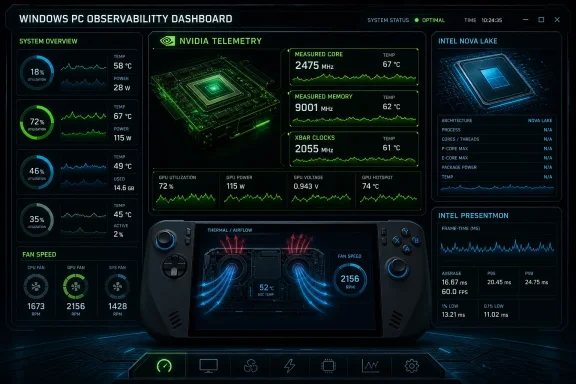 HWiNFO 8.50 Turns Measurement Into the Main Feature
HWiNFO has released version 8.50 of its hardware information and sensor monitoring software, and the headline changes are classic HWiNFO: fewer marketing claims, more raw visibility. Per HWiNFO’s own version history, this release adds fan speed monitoring on MSI Claw 8, improves Intel Nova Lake support, enhances sensor monitoring on Maxsun 275HX series systems, updates Intel PresentMon, and adds measured NVIDIA GPU core, memory, and XBAR clock monitoring.That sounds like a maintenance release until you place it in the context of the current Windows hardware market. Handheld gaming PCs are behaving more like laptops, laptops are behaving more like consoles, desktop GPUs are behaving more like power-managed workstation devices, and Windows is expected to make all of it look coherent. HWiNFO’s job is not to make those layers simple. Its job is to expose enough of the system that a user can make an informed decision.
The practical result is a version that matters to gamers, overclockers, reviewers, support desks, and admins who use HWiNFO as a sanity check when OEM dashboards, Windows counters, BIOS pages, and vendor control panels tell different versions of the same story. This is not a control update; it is an observability update. That distinction matters.
The MSI Claw 8 Fan Sensor Is Small Only If You Have Never Troubleshot a Handheld
The most visible consumer-facing change in HWiNFO 8.50 is the addition of fan speed monitoring on MSI Claw 8. For a desktop builder, a fan RPM readout can feel routine. For a Windows handheld, it can be the difference between guessing and knowing.Handheld gaming PCs compress a Windows laptop’s thermal problem into a console-shaped enclosure. The CPU, graphics, memory, storage, battery, display, and cooling system all compete inside a chassis that users hold in their hands. When performance drops, fan noise spikes, or frame pacing becomes erratic, the user needs to know whether the device is heat-soaked, power-limited, firmware-governed, or simply behaving normally under its current profile.
That is where HWiNFO’s Claw 8 fan support matters. It does not magically improve cooling. It does not grant fan-curve control. It does not promise that every Claw-related thermal complaint has one obvious answer. What it does is bring one more previously opaque data point into the same sensor view as CPU temperature, GPU behavior, power readings, clocks, and logging.
For MSI Claw 8 owners who already build overlays using HWiNFO and tools such as RivaTuner Statistics Server, a fan-speed reading is especially useful. A temperature overlay without fan context can mislead. A high temperature with low fan speed suggests a different troubleshooting path than a high temperature with a high fan reading. A fan-speed change that does not correspond to a visible temperature increase may also be useful evidence when comparing behavior across power modes, BIOS versions, or workloads.
The important boundary is that HWiNFO’s changelog describes monitoring support. It does not claim fan control. It does not specify a broader compatibility matrix beyond MSI Claw 8. It does not say that all related handheld variants expose identical sensors. Users should treat the new readout as monitoring support, not as evidence that every thermal behavior can now be modified or overridden.
NVIDIA’s New Measured Clocks Add More Detail to GPU Telemetry
The most technically interesting addition in HWiNFO 8.50 is support for monitoring measured core, memory, and XBAR clocks on NVIDIA GPUs. HWiNFO says the update adds monitoring of measured Core, Memory, and XBAR clocks, giving users additional clock telemetry alongside existing NVIDIA GPU sensors.The word “measured” is doing the work here, but it should not be overread. GPU monitoring has always included clock values that can describe different things: driver-reported clocks, effective behavior, domain clocks, boost states, memory rates, and other values exposed through hardware and software telemetry paths. HWiNFO 8.50 adds another set of readings for users who want more detail than a single generic GPU clock line.
Core clock and memory clock are familiar to most enthusiasts. XBAR is less consumer-facing, but it belongs to the same larger point: modern GPUs are not one simple clock domain. They contain multiple internal domains, and monitoring tools increasingly expose more of that detail. For reviewers, overclockers, and users comparing logs, having measured core, memory, and XBAR clock fields may make a sensor capture more complete.
The release notes do not specify whether the new measured NVIDIA readings require a particular GPU architecture, driver branch, firmware implementation, or configuration. That absence should keep expectations realistic. Some users may see the new sensors immediately. Others may not, depending on the GPU, driver, firmware, permissions, or how the NVIDIA telemetry path is exposed to third-party software.
More sensors also mean more opportunities for misinterpretation. A measured XBAR clock appearing lower or different than expected does not automatically indicate a fault. A measured memory clock line should not be treated as a complete diagnosis of memory performance. A measured core clock value should be interpreted alongside workload, utilization, power, temperature, and time. HWiNFO is giving users more evidence, not a universal diagnosis.
The practical advice is simple: if you use HWiNFO for NVIDIA GPU logging, add the new measured clock fields to your view, capture a few baseline runs, and compare them with your existing sensor set before changing any performance assumptions. The new values are useful because they add context. They are not a reason to discard the rest of the log.
Nova Lake Support Shows HWiNFO Preparing Its Platform Coverage
HWiNFO 8.50 also improves Intel Nova Lake support. That line is less immediately useful to most users than Claw 8 fan monitoring or NVIDIA clock readings, but it is still part of the update’s instrumentation story. Hardware monitoring tools have to track new CPU platforms as they appear in development, validation, review, and eventual retail systems.Processor support is not merely a matter of putting a name in a summary window. A monitoring tool has to identify platform characteristics, expose available sensors, and report hardware information in a way that makes sense to the user. Early and improved support can be incremental, especially when firmware and platform behavior continue to mature.
The Nova Lake line should be read narrowly. HWiNFO 8.50 improves Intel Nova Lake support. It does not reveal Nova Lake specifications. It does not establish a launch date. It does not prove retail readiness. It does not mean every sensor on every future Nova Lake system is final or complete. It is better understood as platform-support work inside the monitoring layer.
For WindowsForum readers, the practical lesson is straightforward. If you work with early hardware, review samples, OEM systems, validation benches, or enthusiast builds around new Intel platforms, monitoring tool version matters. An old HWiNFO build may launch and show familiar fields, but that does not mean it understands the platform well enough for serious diagnosis.
This is one reason IT pros and reviewers should be cautious about copying sensor interpretations from one CPU generation to the next. A temperature label, power reading, or clock domain name can look familiar while being implemented differently on newer hardware. HWiNFO 8.50’s improved Nova Lake support is an incremental step in keeping the tool aligned with Intel’s upcoming platform work.
PresentMon Remains the Bridge Between Sensors and the Frame You Actually Saw
HWiNFO 8.50 updates Intel PresentMon, the component that helps connect hardware behavior with real-time graphics performance. PresentMon matters because frame rate averages are blunt instruments. A game can report a respectable average FPS while still feeling uneven, delayed, or unstable.HWiNFO’s integration of PresentMon gives users a way to connect performance telemetry with the broader sensor environment. That is important because a frame-time spike by itself is only a symptom. A spike aligned with a GPU clock change, CPU package power change, fan-speed change, temperature plateau, or background load is closer to a useful troubleshooting record.
The release notes do not specify which PresentMon changes are included in this update, so the safe reading is simply that HWiNFO has refreshed its integrated PresentMon component. That is still useful. PresentMon is part of the chain that lets Windows gamers move from “this feels bad” to “this frame pacing event coincided with these hardware conditions.”
That chain is becoming more valuable as handhelds, laptops, and desktops all adopt more aggressive power management. On a desktop with a large cooler and high power budget, a performance anomaly may be easier to isolate. On a handheld or thin laptop, the system may be balancing frame output, package power, fan behavior, surface temperature targets, battery drain, and background Windows activity at the same time. The frame is the user-visible output of that negotiation.
HWiNFO 8.50 does not turn PresentMon into a one-click answer machine. It does, however, keep HWiNFO aligned with the performance-analysis workflow used by many reviewers and enthusiasts. The best troubleshooting sessions increasingly combine three views: what the user saw, what the frame-time data recorded, and what the hardware sensors were doing at the same moment.
Maxsun, Corsair, ACPI, and Display Audio Are the Update’s Quiet Infrastructure Work
Beyond the headline Claw 8 and NVIDIA changes, HWiNFO 8.50 includes a cluster of support improvements that will matter intensely to narrower groups of users. The release enhances sensor monitoring on Maxsun 275HX series systems, improves Corsair Link device support, adds ACPI version reporting, and adds Display Audio monitor capability information.Those are not the lines that drive broad attention, but they are part of why HWiNFO remains useful in the Windows ecosystem. PC hardware is not standardized in the way buyers often imagine. Motherboard vendors expose sensors differently. Cooling ecosystems depend on USB controllers, firmware protocols, and vendor utilities. ACPI tables describe platform capabilities in ways that can affect power and device behavior. Display audio capability information can matter when debugging monitor, GPU, and audio-path issues.
Maxsun 275HX support is a good example. A user with one of those systems does not care whether the improvement is globally exciting. They care whether board-specific telemetry appears accurately enough to troubleshoot a real machine. For builders and support communities, that is where tool credibility is earned: not in universal features, but in the specific sensor that finally appears where it should.
Corsair Link support sits in the same category. Many enthusiast PCs are now miniature ecosystems of controllers, coolers, hubs, lighting devices, and monitoring interfaces. When the monitoring layer fails to see a device, the user may not know whether the device is faulty, the USB path is unstable, the vendor utility is interfering, or the third-party tool lacks support. Improved Corsair Link device support reduces one source of ambiguity.
ACPI version reporting is even more diagnostic than decorative. ACPI is one of the deeper layers through which firmware describes hardware and power-management behavior to the operating system. Most users will never need to know the ACPI version surfaced by HWiNFO. But when debugging firmware oddities, sleep behavior, device enumeration, or platform reporting differences across BIOS versions, having that detail in the report can save time.
Display Audio monitor capability information is similarly specialized. It may help in cases where a GPU-connected monitor’s audio capabilities or display path behavior need to be understood. Again, this is not a feature that changes a gaming benchmark. It is a feature that can make a support thread shorter.
The Bug Fixes Tell You Which Users Were Getting Hurt
The most important fixes in HWiNFO 8.50 are not necessarily the most dramatic ones. The release fixes lost Custom and WHEA sensors, fixes recognition of the AMD Radeon RX 6500XT, and fixes a possible crash when a sensor name is too long. Each fix points to a different class of user pain.Custom sensors matter because HWiNFO is often not used alone. Enthusiasts build dashboards around it. Admins may log selected readings. Reviewers may define views that match a test method. Users may publish sensors into shared memory for overlays or other tools. Losing custom sensors is not cosmetic when your monitoring setup depends on them.
WHEA sensors matter because Windows Hardware Error Architecture data can be an early warning sign for instability. Users chasing memory errors, PCIe problems, marginal overclocks, undervolts, power delivery issues, or platform instability often watch WHEA-related reporting carefully. If those sensors disappear, an unstable system can look cleaner than it is.
The AMD Radeon RX 6500XT recognition fix is a narrower but still meaningful correction. Misrecognition undermines confidence in every other reading. If a tool identifies a GPU incorrectly, a user has to wonder what else is wrong: power limits, clocks, memory configuration, driver path, or feature detection. Correct naming is the first layer of trust.
The long sensor-name crash fix is the kind of bug that sounds minor until it hits a production logging box, a reviewer’s test bench, or a user’s carefully assembled overlay. Sensor ecosystems are sprawling. Device names, vendor labels, firmware strings, and custom labels can become unexpectedly long. A monitoring tool should degrade gracefully when names are ugly. HWiNFO 8.50’s fix suggests one more edge case has been closed.
The New OSD Background Option Is a Usability Feature Masquerading as a Cosmetic One
HWiNFO 8.50 adds an option to change the on-screen display background color. That is easy to dismiss until you remember where OSDs are used: over games, benchmarks, stress tests, capture footage, remote troubleshooting sessions, and sometimes shaky phone videos sent to support forums.Overlay readability matters. A sensor value that cannot be read against a bright game scene might as well not exist. A background color option helps users tune contrast without changing the rest of their monitoring stack. It also helps standardize screenshots and videos, which matters when people are comparing behavior across systems.
This becomes especially relevant for handhelds. A desktop user can glance at a second monitor. A handheld user often has one small screen, a game, an overlay, and a limited amount of visual space. If HWiNFO is going to be part of the handheld troubleshooting toolkit, its OSD needs to be legible without becoming intrusive.
There is also a content-creation angle. Reviewers and technically minded creators frequently rely on overlays to show power, temperature, utilization, clocks, and frame pacing in real time. A more readable OSD reduces ambiguity for the audience. The color of a background box is not the story; the ability to see the sensor clearly during a transient performance event is.
What to Do Now After Updating to HWiNFO 8.50
If you use HWiNFO casually, installing the update and opening the Sensors window may be enough. If you rely on HWiNFO for overlays, logging, validation, or troubleshooting, take a few minutes to verify the specific areas changed in 8.50 before trusting your usual layout.First, if you own or support an MSI Claw 8, open the HWiNFO Sensors window and look for the newly available fan-speed reading. Confirm that fan RPM appears during idle and under load, then start a short logging session while launching a game, benchmark, or repeatable workload. Save that log as a baseline. The key is not to assume the number proves anything by itself, but to confirm that the fan reading is visible and can be recorded alongside temperature, clocks, and power data.
Second, re-check Custom and WHEA sensors. If your previous HWiNFO setup used custom sensor labels, custom groups, shared-memory feeds, or WHEA-related readings, verify that those entries still appear after the update. Open the Sensors window, expand the relevant Custom and WHEA sections, and confirm that your overlay or logging profile still includes the fields you expect. If you maintain repeatable test templates, run a short log and confirm the resulting CSV includes the same Custom and WHEA columns you rely on.
Third, on NVIDIA GPU systems, look for the new measured core, memory, and XBAR clock fields. Add them to your sensor layout or logging profile, but do not immediately replace older clock fields in your process. For the first few runs, log both the existing GPU clock readings and the new measured readings so you can see how they differ on your system. That before-and-after comparison is more useful than treating any one field as automatically authoritative.
Fourth, if you use an on-screen display, verify overlay visibility after the update. Check whether the new OSD background color option improves readability in the actual games, benchmarks, or workloads where you use it. Do not judge the overlay only on the desktop. Test it against a bright scene, a dark scene, and a fast-moving scene. If you record footage or share troubleshooting clips, make sure the sensor text remains legible after compression.
Finally, if your system includes Corsair Link devices, a Maxsun 275HX series platform, a Radeon RX 6500XT, or display audio configurations that you previously had to inspect manually, open the relevant HWiNFO hardware and sensor views after updating. Confirm that the device names, sensor groups, and capability information look sensible before using the tool as evidence in a support thread or validation report.
More Telemetry Also Means More Ways to Fool Yourself
Every monitoring update creates a paradox. Better visibility should lead to better decisions, but only if users understand what the readings mean and what they do not mean. HWiNFO 8.50 adds useful telemetry, but it also increases the temptation to overinterpret individual numbers.A fan speed reading on MSI Claw 8 does not by itself prove that a fan curve is good or bad. A measured NVIDIA memory clock does not by itself prove a memory bottleneck. An XBAR clock reading does not by itself explain a frame-time spike. An ACPI version does not by itself diagnose a firmware bug. These values become useful when they are correlated with workload, time, temperature, power, errors, and reproducible behavior.
That is the discipline HWiNFO rewards. The tool is strongest when users log data over time, compare before-and-after conditions, and resist the urge to treat every unfamiliar sensor as a crisis. A single screenshot can start a conversation, but a log file usually tells the truth.
This is especially important for WHEA monitoring. Seeing WHEA-related information vanish because of a bug is bad. Seeing WHEA information return is good. But interpreting hardware errors requires care. Some errors are catastrophic, some are corrected, some are platform-specific, and some appear only under certain combinations of firmware, drivers, memory settings, or power states. HWiNFO can surface the signal. It cannot replace judgment.
The same applies to NVIDIA measured clocks. Enthusiasts often want one number that explains performance. Modern GPUs rarely oblige. Clock behavior is shaped by workload, voltage, power, temperature, driver policy, silicon quality, and application behavior. HWiNFO 8.50 adds more pieces of that behavior to the display. It does not make the system simple.
Why Windows Admins Should Care About a Tool Enthusiasts Love
HWiNFO is often discussed as an enthusiast utility, but releases like 8.50 have a quiet enterprise relevance. Windows admins may not deploy HWiNFO everywhere, and licensing or policy constraints will determine where it is appropriate. But in labs, support benches, workstation fleets, creator PCs, gaming-adjacent offices, and hardware validation environments, accurate sensor visibility can shorten expensive troubleshooting cycles.The Claw 8 addition is consumer-facing, but the principle applies broadly. Mobile and compact Windows systems increasingly hide thermal and power behavior behind vendor utilities. When users complain about performance, heat, fan noise, or battery drain, support teams need evidence. Without third-party telemetry, the answer often becomes a cycle of BIOS updates, driver reinstalls, Windows resets, and guesswork.
The Nova Lake support matters to organizations that evaluate new client platforms early. IT teams do not need to wait for a platform to become mainstream before they start caring about its telemetry. If a new CPU generation changes power behavior or sensor reporting, support playbooks need to evolve before deployment.
The PresentMon update matters for any organization supporting graphics-heavy workloads. That includes game studios, visualization teams, CAD users, video production, simulation environments, and test labs. When a user reports “lag,” “stutter,” or “slow rendering,” frame-pacing data tied to system telemetry is more useful than average utilization alone.
The bug fixes matter because monitoring reliability is part of operational reliability. A tool that loses custom sensors can break a repeatable test method. A tool that loses WHEA sensors can hide instability signals. A tool that crashes on an unusually long sensor name can interrupt logging at exactly the wrong time.
Action checklist for admins
- Validate HWiNFO 8.50 on representative hardware before replacing an older build in a lab, support bench, or test workflow.
- Open the Sensors window after upgrading and confirm that Custom sensor groups still appear with the expected names and values.
- Expand WHEA-related sensor entries and confirm that any expected WHEA counters or error-reporting fields are visible before relying on the system for stability testing.
- Run a short CSV logging session and verify that the exported log includes the Custom and WHEA columns used by your scripts, dashboards, or review templates.
- For MSI Claw 8 support cases, add fan RPM to logs alongside CPU temperature, GPU temperature, power readings, clock fields, and PresentMon frame-time data.
- On NVIDIA GPU systems, add the measured core, memory, and XBAR clock readings to a test profile, but keep existing GPU clock fields until you understand how the new fields appear in your own logs.
- If you use overlays for help desk captures or user-submitted evidence, test the OSD background color setting against real workloads and confirm the values remain readable in screenshots and recordings.
- If Corsair Link devices are part of a test system, confirm that the relevant device group appears in HWiNFO before assuming a missing reading indicates a hardware or USB fault.
- If you support systems with Radeon RX 6500XT graphics, confirm that the GPU is recognized correctly before comparing readings with older support notes or inventory records.
- If a system previously crashed or behaved unpredictably with unusually long sensor names, repeat the same monitoring layout under HWiNFO 8.50 before putting it back into unattended logging.
The Bigger Windows Lesson: Instrumentation Is Infrastructure
The HWiNFO 8.50 release is not a revolution, and that is the point. Windows hardware support is maintained through a thousand small acts of recognition: this handheld fan, that GPU clock domain, this board sensor, that display capability, this firmware-reported ACPI detail, that crash caused by an awkward sensor name.Users tend to notice monitoring tools only when they are wrong. A missing fan sensor becomes visible when a handheld gets loud. A missing WHEA sensor becomes visible when an overclock looks stable until it does not. A GPU misrecognition becomes visible when a support thread starts with the wrong hardware. A crash caused by a long sensor name becomes visible when logging stops during the test that mattered.
HWiNFO 8.50 addresses several of those failure points. It adds MSI Claw 8 fan monitoring for handheld owners. It improves Intel Nova Lake support for future-facing platform coverage. It enhances Maxsun 275HX sensor monitoring for users on that hardware. It updates Intel PresentMon for frame-analysis workflows. It adds measured NVIDIA core, memory, and XBAR clock monitoring for more detailed GPU telemetry. It fixes lost Custom and WHEA sensors. It adds ACPI version reporting, improves Corsair Link support, adds Display Audio monitor capability information, adds an OSD background color option, fixes Radeon RX 6500XT recognition, and resolves a possible crash caused by an overly long sensor name.
That collection is not flashy, but it is coherent. The update makes HWiNFO better at seeing the system, better at staying stable while seeing it, and better at presenting the information users need while Windows hardware keeps getting more complicated.
For enthusiasts, that means better overlays and better logs. For reviewers, it means more complete test captures. For support communities, it means fewer blind spots. For admins, it means another reason to treat monitoring-tool versions as part of the diagnostic environment rather than an afterthought.
The best way to read HWiNFO 8.50 is not as a feature drop, but as calibration. The Windows PC is still becoming more heterogeneous, more power-managed, more firmware-dependent, and more difficult to summarize with one dashboard. HWiNFO’s value is that it keeps chasing the details. In this release, those details happen to include a handheld fan, a future Intel platform, new NVIDIA measured clock fields, refreshed PresentMon integration, device-support refinements, and sensor fixes that protect the reliability of existing workflows.
That is enough to make HWiNFO 8.50 worth the update for anyone who uses the tool as more than a curiosity. If your troubleshooting process depends on what the Sensors window says, this is the kind of release you install, verify, and baseline before the next mystery starts.
References
- Primary source: videocardz.com
Published: 2026-07-09T20:00:22.026183
- Related coverage: hwinfo.com
Versions History | HWiNFO
Upcoming cahnges and version history of HWiNFO 32/64. Latest version, Upcoming changes and Full version history.www.hwinfo.com
- Related coverage: chip.de
HWiNFO - Download - CHIP
HWiNFO 8.50 Englisch: HWiNFO, ein kostenloses Windows-Diagnose-Tool, informiert Sie über die Hardware-Ausstattung Ihres PCs.www.chip.de - Related coverage: storage-asset.msi.com