

Tesla China’s June rebound was factory-led and Model-Y-led, not a broad domestic recovery. Domestic deliveries rose from May, but remained below June 2025 as exports supported Shanghai’s wholesale growth and Model 3 weakened.
June supports two apparently contradictory accounts: Tesla’s China-made wholesale volume grew strongly, while deliveries to customers inside China declined year-on-year. Both statements are accurate because they measure different parts of the operation.
Wholesale volume includes Shanghai-built Model 3 and Model Y vehicles delivered domestically or exported. Domestic deliveries count only vehicles sold in China.
The supplied Basenor/CnEVPost snapshot puts June wholesale volume at 89,091 vehicles and exports at 36,171. Subtracting exports leaves 52,920 domestic deliveries.
This is the definitive distinction for reading the month: Tesla’s Shanghai operation expanded at the wholesale level while its Chinese retail deliveries contracted from a year earlier.
The eighth consecutive month of wholesale-volume growth indicates continued momentum in Shanghai’s combined domestic-and-export activity. It should not be described as an eight-month streak of year-on-year growth without additional supporting data for each month.
Exports accounted for about 40.6% of June wholesale volume. That kept the factory-level result substantially stronger than the domestic result, although one month of data cannot establish why vehicles were allocated between China and overseas markets.
The supplied snapshot described Model Y as the best-selling model across all propulsion types in China during June. That reported ranking reinforces the scale of its monthly performance, but the delivery trend itself is the more important measure: Model Y rebounded sharply from May while remaining below its June 2025 level.
The comparison explains why Tesla’s total rose 11.93% from May even though Model 3 declined by more than one-fifth. Model Y’s increase was large enough to offset the sedan’s drop.
The annual figures provide the necessary counterweight. Both vehicles were down by roughly 14% from June 2025, so June was a sequential rebound from a weaker May rather than a return to the prior year’s domestic pace.
Possible explanations for the Model Y jump include delivery timing, a product-cycle response, promotions, deferred purchases, or quarter-end execution. Those remain hypotheses. June data alone cannot determine their relative importance or show whether the higher volume represents a sustainable demand baseline.
Q3 will provide the clearer test. If Model Y maintains stronger monthly deliveries after June, the rebound will look more durable. If volume falls back quickly, timing effects will become a more plausible explanation.
That concentration amplified the benefit of its 33.70% monthly increase. It also means that changes in one vehicle now have an outsized effect on Tesla China’s total.
June demonstrated the favorable side of concentration: Model Y lifted the company despite Model 3’s decline. The year-on-year comparison shows the limit of that result. Model Y remained 13.81% below June 2025 even after its monthly rebound.
The operational question is therefore straightforward. Tesla needs Model Y to maintain momentum, but a healthier domestic result would also require Model 3 to stabilize. Continued growth in one model alongside contraction in the other could improve the headline total while making the lineup even more dependent on a single vehicle.
The figures do not prove that concentration will damage future performance. They show that Tesla has little model-level diversification within the reported domestic mix, making the direction of each core vehicle unusually consequential.
The first-half figures make the weakness harder to dismiss as ordinary month-to-month variation. Tesla delivered 66,442 Model 3 sedans in China during the first half of 2026, down 27.72% from the corresponding period in 2025, according to the supplied snapshot.
That does not identify a single cause. It does establish that the decline extended beyond June and that the sedan’s performance was materially weaker across a six-month period.
Model Y and Model 3 were sold under the same brand in the same market, yet their June month-on-month movements differed by more than 56 percentage points. That divergence cautions against treating Tesla China as one uniform demand curve.
The data instead points to a model-specific split. Model Y gained substantial momentum from May; Model 3 lost momentum and entered the second half from a much weaker first-half position.
The next useful signal will not be whether Model 3 matches Model Y’s volume. The vehicles occupy different categories and have different demand profiles. The immediate test is whether Model 3 can stop posting large year-on-year declines and establish a more stable monthly range.
Shanghai’s 36,171 exports demonstrate the factory’s importance beyond the domestic market. Exports equaled about 68.4% of domestic deliveries and represented roughly four out of every ten vehicles in wholesale volume.
That production flexibility can help Tesla serve multiple regions from Shanghai. It also means the factory’s performance and Tesla’s standing with Chinese buyers can move in different directions.
The June figures do not prove that Tesla deliberately “redirected” vehicles overseas because domestic demand softened. Export totals can be affected by regional orders, logistics, shipping schedules, production planning, inventory, and delivery timing. Without supporting allocation or order data, redirection should be treated only as a hypothesis.
What the numbers establish is narrower and more useful: Shanghai distributed far more vehicles than Tesla delivered inside China, and exports created most of the gap.
A factory-level increase is favorable for production activity and global supply. It is not, by itself, evidence that Tesla gained domestic momentum against the prior year.
China accounted for 26.28% of Tesla’s global Q2 deliveries, according to the supplied Basenor/CnEVPost snapshot. That share can be interpreted without stating an unsupported global delivery total.
The percentage measures China’s contribution to Tesla’s worldwide deliveries, not Tesla’s share of the Chinese vehicle market. A lower contribution can result from weaker China deliveries, stronger deliveries elsewhere, or a combination of the two.
The snapshot describes 26.28% as China’s lowest contribution since late 2020. If read alongside the 2.05% decline in Q2 domestic deliveries, it suggests that China became a smaller part of Tesla’s global delivery mix while Shanghai remained a major manufacturing and export base.
That creates an important separation between China as a production center and China as a destination. Shanghai can remain central to Tesla’s global operations even if Chinese customers account for a smaller portion of worldwide deliveries.
The Q2 number should not be treated as an automatic verdict on Tesla’s global position. It is a benchmark for the next quarter. If China’s contribution rises alongside stronger domestic model results, June may look like the beginning of a recovery. If the contribution falls while both models remain down year-on-year, the domestic weakness will look more persistent.
Model Y’s monthly surge lifted the company total. Model 3’s decline increased Tesla’s reliance on Model Y. There was no third high-volume Tesla nameplate in the snapshot to offset the sedan’s weakness or broaden the recovery.
This does not prove that Tesla’s product strategy is fundamentally flawed. The wholesale total shows that Shanghai can generate substantial volume with a concentrated lineup. The domestic figures show the commercial trade-off: each vehicle must carry a large share of the result.
The June mix therefore creates two different measures of progress for Q3. Total domestic deliveries need to improve, but the quality of that improvement also matters.
A recovery led entirely by Model Y would still be a recovery, though a concentrated one. A recovery in which Model Y holds its gains and Model 3 reduces its annual decline would be broader and less vulnerable to movement in a single model.
Monthly comparisons can be influenced by production flow, delivery scheduling, logistics, incentives, product-cycle timing, and quarter-end execution. The available data does not isolate any of those factors.
The 13.81% year-on-year decline supplies essential context. Model Y simultaneously experienced a strong rebound from May and remained below its level from one year earlier.
The same framework applies to Tesla’s domestic total. Deliveries rose 11.93% month-on-month but fell 13.93% year-on-year. June was better than May and worse than June 2025.
Those statements are complementary, not contradictory. They describe a partial recovery that had not yet restored the previous annual pace.
The strongest Q3 outcome would have two components: Model Y sustaining enough volume to confirm a higher baseline and Model 3 moving toward stability. June delivered evidence for the first possibility but not the second.
The figures only appear to conflict when they are compressed into a generic label such as “China sales.” Once separated, they describe a coherent result: strong factory distribution and exports, improved domestic volume from May, weaker domestic volume from June 2025, and a recovery dominated by Model Y.
One month cannot establish that this balance represents a permanent strategic transition. Export allocations vary, and the supplied data does not disclose Tesla’s order book, inventory targets, shipping plans, or internal production decisions.
The Q2 contribution figure makes the balance worth tracking beyond June. China represented 26.28% of global deliveries while Shanghai remained capable of generating 89,091 vehicles of monthly wholesale volume.
The factory can therefore remain important to Tesla even if China’s share of global deliveries declines. That is operational resilience, but it does not erase the need to evaluate domestic demand independently.
Model Y’s June result showed that Tesla can still produce a major model-level gain in China. Model 3’s first-half decline showed that momentum did not extend across the lineup.
The question for the second half is whether Tesla can convert a factory-led June result into a broader domestic improvement.
Q2 2026 — Tesla delivered 126,157 vehicles in China, down 2.05% year-on-year and equal to 26.28% of its global deliveries.
June 2026 — Domestic Tesla deliveries reached 52,920, rising 11.93% from May but falling 13.93% from June 2025.
June 2026 — Model Y reached 38,654 deliveries, while Model 3 recorded 14,266, sending the two vehicles in opposite month-on-month directions.
June 2026 — Shanghai wholesale volume reached 89,091 vehicles, including 36,171 exports, extending the wholesale-volume growth streak to eight months.
Q3 2026 — Monthly data will test whether Model Y can sustain its rebound, Model 3 can stabilize, and domestic deliveries can close their year-on-year deficit.
The first test is Model Y persistence. June’s 38,654 deliveries provide the benchmark, but the year-on-year comparison will matter more than whether each month precisely matches the quarter-ending total.
The second test is Model 3 stabilization. Its 22.34% monthly decline, 14.25% annual decline, and 27.72% first-half decline establish a weak starting point. Smaller annual declines would be an early sign of improvement even before the sedan returns to growth.
The third test is the balance between domestic deliveries and wholesale volume. A higher domestic-to-wholesale ratio could indicate that more of Shanghai’s distributed volume is being absorbed in China, although shipping schedules and regional allocation would still need to be considered.
The fourth test is export volume. Continued high exports would reinforce Shanghai’s role in Tesla’s global production network, while a sharp change would require context before being interpreted as stronger or weaker overseas demand.
The final test is China’s share of global Q3 deliveries. The Q2 benchmark is 26.28%. Its direction should be read together with domestic model performance rather than in isolation.
June can be a genuine improvement without being a complete recovery. Q3 must show whether the Model Y rebound lasts and whether it spreads beyond one vehicle.
52,920 shows that Tesla’s domestic deliveries recovered from May but remained below the prior year. 89,091 shows that Shanghai’s broader wholesale operation was much stronger than its domestic result. 36,171 explains the gap through exports without proving why those vehicles were allocated overseas.
At the product level, 38,654 shows Model Y driving the rebound, while 14,266 shows Model 3 moving in the opposite direction. At the quarterly level, 26.28% establishes China’s contribution to Tesla’s global deliveries and gives Q3 a clear benchmark.
Together, they support a precise conclusion: Tesla China ended Q2 with a productive factory and a powerful Model Y rebound, but not yet with a broad domestic recovery. Q3 will determine whether June marked a durable turn or a concentrated improvement led by one model and supported by exports.
The figures show a productive Shanghai factory, a sharp monthly Model Y rebound, and continued pressure on Tesla’s domestic business. They do not establish that China demand has fully recovered.Six Numbers That Define Tesla China’s June
52,920 — Tesla vehicles were delivered to customers in China, up 11.93% from May but down 13.93% from June 2025.
89,091 — Shanghai wholesale volume, including domestic deliveries and exports, rose 24.43% year-on-year and extended its growth streak to eight consecutive months.
36,171 — Shanghai-built vehicles were exported during June, accounting for the difference between wholesale volume and domestic deliveries.
38,654 — Model Y deliveries in China rose 33.70% from May but remained 13.81% below June 2025.
14,266 — Model 3 deliveries in China fell 22.34% from May and 14.25% year-on-year.
26.28% — China contributed this share of Tesla’s global deliveries during Q2 2026, according to the supplied Basenor/CnEVPost snapshot.
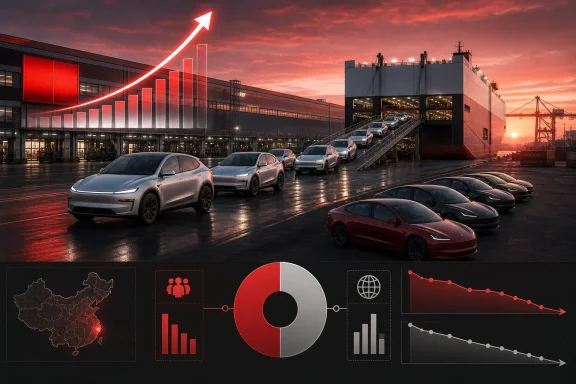 One Month Produced Two Conflicting Tesla Headlines
June supports two apparently contradictory accounts: Tesla’s China-made wholesale volume grew strongly, while deliveries to customers inside China declined year-on-year. Both statements are accurate because they measure different parts of the operation.Wholesale volume includes Shanghai-built Model 3 and Model Y vehicles delivered domestically or exported. Domestic deliveries count only vehicles sold in China.
The supplied Basenor/CnEVPost snapshot puts June wholesale volume at 89,091 vehicles and exports at 36,171. Subtracting exports leaves 52,920 domestic deliveries.
| June 2026 measure | Vehicles | What it shows |
|---|---|---|
| Shanghai wholesale volume | 89,091 | Total China-made volume distributed domestically and overseas |
| Exports | 36,171 | Shanghai-built vehicles sent to markets outside China |
| Domestic deliveries | 52,920 | Vehicles delivered to customers inside China |
The eighth consecutive month of wholesale-volume growth indicates continued momentum in Shanghai’s combined domestic-and-export activity. It should not be described as an eight-month streak of year-on-year growth without additional supporting data for each month.
Exports accounted for about 40.6% of June wholesale volume. That kept the factory-level result substantially stronger than the domestic result, although one month of data cannot establish why vehicles were allocated between China and overseas markets.
Model Y Turned June Into a Sequential Recovery
Tesla’s improvement from May came from Model Y. The crossover recorded 38,654 domestic deliveries, representing 73.04% of Tesla’s June China total and rising 33.70% month-on-month.The supplied snapshot described Model Y as the best-selling model across all propulsion types in China during June. That reported ranking reinforces the scale of its monthly performance, but the delivery trend itself is the more important measure: Model Y rebounded sharply from May while remaining below its June 2025 level.
| Model | June 2026 deliveries | Tesla China share | Month-on-month | Year-on-year |
|---|---|---|---|---|
| Model Y | 38,654 | 73.04% | +33.70% | -13.81% |
| Model 3 | 14,266 | 26.96% | -22.34% | -14.25% |
The annual figures provide the necessary counterweight. Both vehicles were down by roughly 14% from June 2025, so June was a sequential rebound from a weaker May rather than a return to the prior year’s domestic pace.
Possible explanations for the Model Y jump include delivery timing, a product-cycle response, promotions, deferred purchases, or quarter-end execution. Those remain hypotheses. June data alone cannot determine their relative importance or show whether the higher volume represents a sustainable demand baseline.
Q3 will provide the clearer test. If Model Y maintains stronger monthly deliveries after June, the rebound will look more durable. If volume falls back quickly, timing effects will become a more plausible explanation.
A 73% Mix Shows Strength and Concentration
Model Y’s 73.04% share makes it Tesla’s clear domestic franchise vehicle. Nearly three out of every four Teslas delivered in China during June were Model Ys.That concentration amplified the benefit of its 33.70% monthly increase. It also means that changes in one vehicle now have an outsized effect on Tesla China’s total.
June demonstrated the favorable side of concentration: Model Y lifted the company despite Model 3’s decline. The year-on-year comparison shows the limit of that result. Model Y remained 13.81% below June 2025 even after its monthly rebound.
The operational question is therefore straightforward. Tesla needs Model Y to maintain momentum, but a healthier domestic result would also require Model 3 to stabilize. Continued growth in one model alongside contraction in the other could improve the headline total while making the lineup even more dependent on a single vehicle.
The figures do not prove that concentration will damage future performance. They show that Tesla has little model-level diversification within the reported domestic mix, making the direction of each core vehicle unusually consequential.
Model 3 Is the Harder Problem
Model 3 recorded 14,266 domestic deliveries in June, down 22.34% from May and 14.25% from June 2025. Unlike Model Y, it had no positive comparison in the supplied monthly data.The first-half figures make the weakness harder to dismiss as ordinary month-to-month variation. Tesla delivered 66,442 Model 3 sedans in China during the first half of 2026, down 27.72% from the corresponding period in 2025, according to the supplied snapshot.
That does not identify a single cause. It does establish that the decline extended beyond June and that the sedan’s performance was materially weaker across a six-month period.
Model Y and Model 3 were sold under the same brand in the same market, yet their June month-on-month movements differed by more than 56 percentage points. That divergence cautions against treating Tesla China as one uniform demand curve.
The data instead points to a model-specific split. Model Y gained substantial momentum from May; Model 3 lost momentum and entered the second half from a much weaker first-half position.
The next useful signal will not be whether Model 3 matches Model Y’s volume. The vehicles occupy different categories and have different demand profiles. The immediate test is whether Model 3 can stop posting large year-on-year declines and establish a more stable monthly range.
Shanghai’s Export Engine Did More of the Work
The 89,091 wholesale figure was Tesla China’s strongest June number. It rose 24.43% from June 2025 and extended the wholesale-volume growth streak to eight months.Shanghai’s 36,171 exports demonstrate the factory’s importance beyond the domestic market. Exports equaled about 68.4% of domestic deliveries and represented roughly four out of every ten vehicles in wholesale volume.
That production flexibility can help Tesla serve multiple regions from Shanghai. It also means the factory’s performance and Tesla’s standing with Chinese buyers can move in different directions.
The June figures do not prove that Tesla deliberately “redirected” vehicles overseas because domestic demand softened. Export totals can be affected by regional orders, logistics, shipping schedules, production planning, inventory, and delivery timing. Without supporting allocation or order data, redirection should be treated only as a hypothesis.
What the numbers establish is narrower and more useful: Shanghai distributed far more vehicles than Tesla delivered inside China, and exports created most of the gap.
A factory-level increase is favorable for production activity and global supply. It is not, by itself, evidence that Tesla gained domestic momentum against the prior year.
The Quarter Was More Stable Than June
Tesla delivered 126,157 vehicles in China during Q2 2026, down 2.05% year-on-year. That decline was much smaller than June’s 13.93% annual drop, indicating that the quarter as a whole held up better than its final month on a year-on-year basis.China accounted for 26.28% of Tesla’s global Q2 deliveries, according to the supplied Basenor/CnEVPost snapshot. That share can be interpreted without stating an unsupported global delivery total.
The percentage measures China’s contribution to Tesla’s worldwide deliveries, not Tesla’s share of the Chinese vehicle market. A lower contribution can result from weaker China deliveries, stronger deliveries elsewhere, or a combination of the two.
The snapshot describes 26.28% as China’s lowest contribution since late 2020. If read alongside the 2.05% decline in Q2 domestic deliveries, it suggests that China became a smaller part of Tesla’s global delivery mix while Shanghai remained a major manufacturing and export base.
That creates an important separation between China as a production center and China as a destination. Shanghai can remain central to Tesla’s global operations even if Chinese customers account for a smaller portion of worldwide deliveries.
The Q2 number should not be treated as an automatic verdict on Tesla’s global position. It is a benchmark for the next quarter. If China’s contribution rises alongside stronger domestic model results, June may look like the beginning of a recovery. If the contribution falls while both models remain down year-on-year, the domestic weakness will look more persistent.
Tesla’s Two-Model Lineup Magnifies Every Move
Tesla’s reported June domestic mix consisted of two core vehicles. That simplicity makes the model-level math unusually transparent.Model Y’s monthly surge lifted the company total. Model 3’s decline increased Tesla’s reliance on Model Y. There was no third high-volume Tesla nameplate in the snapshot to offset the sedan’s weakness or broaden the recovery.
This does not prove that Tesla’s product strategy is fundamentally flawed. The wholesale total shows that Shanghai can generate substantial volume with a concentrated lineup. The domestic figures show the commercial trade-off: each vehicle must carry a large share of the result.
The June mix therefore creates two different measures of progress for Q3. Total domestic deliveries need to improve, but the quality of that improvement also matters.
A recovery led entirely by Model Y would still be a recovery, though a concentrated one. A recovery in which Model Y holds its gains and Model 3 reduces its annual decline would be broader and less vulnerable to movement in a single model.
June Created Momentum Without Settling the Trend
Model Y’s 33.70% month-on-month increase is the clearest evidence that Tesla entered the second half with more momentum than it had in May. It is also the figure most likely to be overinterpreted.Monthly comparisons can be influenced by production flow, delivery scheduling, logistics, incentives, product-cycle timing, and quarter-end execution. The available data does not isolate any of those factors.
The 13.81% year-on-year decline supplies essential context. Model Y simultaneously experienced a strong rebound from May and remained below its level from one year earlier.
The same framework applies to Tesla’s domestic total. Deliveries rose 11.93% month-on-month but fell 13.93% year-on-year. June was better than May and worse than June 2025.
Those statements are complementary, not contradictory. They describe a partial recovery that had not yet restored the previous annual pace.
The strongest Q3 outcome would have two components: Model Y sustaining enough volume to confirm a higher baseline and Model 3 moving toward stability. June delivered evidence for the first possibility but not the second.
The Metrics Agree Once Their Scope Is Clear
The supplied Basenor/CnEVPost snapshot contains several layers of performance:- Wholesale: Shanghai distributed 89,091 vehicles across domestic and export destinations.
- Exports: Of that total, 36,171 vehicles went outside China.
- Domestic: Tesla delivered 52,920 vehicles to customers inside China.
- Model mix: Model Y contributed 38,654 domestic deliveries and Model 3 contributed 14,266.
- Quarterly contribution: China represented 26.28% of Tesla’s global Q2 deliveries.
The figures only appear to conflict when they are compressed into a generic label such as “China sales.” Once separated, they describe a coherent result: strong factory distribution and exports, improved domestic volume from May, weaker domestic volume from June 2025, and a recovery dominated by Model Y.
June Fits a Broader Split Between Production and Demand
Tesla’s China operation serves two roles: it sells vehicles to Chinese customers and supplies vehicles to overseas markets. June’s data shows the second role producing the stronger growth comparison.One month cannot establish that this balance represents a permanent strategic transition. Export allocations vary, and the supplied data does not disclose Tesla’s order book, inventory targets, shipping plans, or internal production decisions.
The Q2 contribution figure makes the balance worth tracking beyond June. China represented 26.28% of global deliveries while Shanghai remained capable of generating 89,091 vehicles of monthly wholesale volume.
The factory can therefore remain important to Tesla even if China’s share of global deliveries declines. That is operational resilience, but it does not erase the need to evaluate domestic demand independently.
Model Y’s June result showed that Tesla can still produce a major model-level gain in China. Model 3’s first-half decline showed that momentum did not extend across the lineup.
The question for the second half is whether Tesla can convert a factory-led June result into a broader domestic improvement.
Timeline
First half of 2026 — Tesla delivered 66,442 Model 3 vehicles in China, down 27.72% from the corresponding period in 2025.Q2 2026 — Tesla delivered 126,157 vehicles in China, down 2.05% year-on-year and equal to 26.28% of its global deliveries.
June 2026 — Domestic Tesla deliveries reached 52,920, rising 11.93% from May but falling 13.93% from June 2025.
June 2026 — Model Y reached 38,654 deliveries, while Model 3 recorded 14,266, sending the two vehicles in opposite month-on-month directions.
June 2026 — Shanghai wholesale volume reached 89,091 vehicles, including 36,171 exports, extending the wholesale-volume growth streak to eight months.
Q3 2026 — Monthly data will test whether Model Y can sustain its rebound, Model 3 can stabilize, and domestic deliveries can close their year-on-year deficit.
Q3 Must Show Whether June Was Sustainable
Tesla enters Q3 with stronger sequential domestic momentum than it had in May, but the improvement remains concentrated.The first test is Model Y persistence. June’s 38,654 deliveries provide the benchmark, but the year-on-year comparison will matter more than whether each month precisely matches the quarter-ending total.
The second test is Model 3 stabilization. Its 22.34% monthly decline, 14.25% annual decline, and 27.72% first-half decline establish a weak starting point. Smaller annual declines would be an early sign of improvement even before the sedan returns to growth.
The third test is the balance between domestic deliveries and wholesale volume. A higher domestic-to-wholesale ratio could indicate that more of Shanghai’s distributed volume is being absorbed in China, although shipping schedules and regional allocation would still need to be considered.
The fourth test is export volume. Continued high exports would reinforce Shanghai’s role in Tesla’s global production network, while a sharp change would require context before being interpreted as stronger or weaker overseas demand.
The final test is China’s share of global Q3 deliveries. The Q2 benchmark is 26.28%. Its direction should be read together with domestic model performance rather than in isolation.
June can be a genuine improvement without being a complete recovery. Q3 must show whether the Model Y rebound lasts and whether it spreads beyond one vehicle.
WindowsForum Q3 Scorecard
Readers evaluating July, August, and September should compare the same five metrics every month rather than relying on a single wholesale or domestic headline:- Model Y year-on-year deliveries: Compare each month with the corresponding 2025 month to determine whether the crossover is closing its annual deficit.
- Model 3 year-on-year deliveries: Track whether the sedan’s decline narrows, stabilizes, or deepens after its weak first half.
- Domestic-to-wholesale ratio: Divide domestic deliveries by wholesale volume to measure how much Shanghai-distributed volume remained in China.
- Exports: Record the monthly total and compare it with June’s 36,171 vehicles, while avoiding causal conclusions without shipping and allocation data.
- China’s share of global Q3 deliveries: Compare the full-quarter percentage with Q2’s 26.28% benchmark.
The Six Figures Worth Carrying Into the Second Half
The June takeaway is contained in six connected numbers.52,920 shows that Tesla’s domestic deliveries recovered from May but remained below the prior year. 89,091 shows that Shanghai’s broader wholesale operation was much stronger than its domestic result. 36,171 explains the gap through exports without proving why those vehicles were allocated overseas.
At the product level, 38,654 shows Model Y driving the rebound, while 14,266 shows Model 3 moving in the opposite direction. At the quarterly level, 26.28% establishes China’s contribution to Tesla’s global deliveries and gives Q3 a clear benchmark.
Together, they support a precise conclusion: Tesla China ended Q2 with a productive factory and a powerful Model Y rebound, but not yet with a broad domestic recovery. Q3 will determine whether June marked a durable turn or a concentrated improvement led by one model and supported by exports.
References
- Primary source: BASENOR - Tesla Accessories
Published: 2026-07-10T10:50:11.928703
Loading…
www.basenor.com - Related coverage: ir.tesla.com
Loading…
ir.tesla.com - Related coverage: investing.com
Loading…
www.investing.com - Related coverage: tesla.com
Loading…
www.tesla.com - Related coverage: carnewschina.com
Loading…
carnewschina.com - Related coverage: scmp.com
Loading…
www.scmp.com
- Related coverage: cnevpost.com
Loading…
cnevpost.com - Related coverage: benzinga.com
Loading…
www.benzinga.com - Related coverage: thestreet.com
Loading…
www.thestreet.com - Related coverage: evwire.com
Loading…
evwire.com - Related coverage: de.investing.com
Loading…
de.investing.com - Related coverage: investorshub.advfn.com
Loading…
investorshub.advfn.com - Related coverage: cincodias.elpais.com
Loading…
cincodias.elpais.com - Related coverage: lemonde.fr
Tesla struggles in China as market share collapses
By focusing on design and performance, the American manufacturer was a pioneer in getting Chinese motorists to adopt electric cars. Although 40% of its sales are now in China, Tesla has become a minor player, constantly forced to adapt.www.lemonde.fr