

A new How-To Geek report argues that Excel’s PIVOTBY function still cannot fully replace PivotTables in polished, refreshable reports—not because of calculation limits, but because conditional formatting does not reliably follow a changing spill range.
PIVOTBY is Microsoft’s formula-based tool for grouping, aggregating, sorting, and filtering data across row and column axes. It can produce PivotTable-like summaries directly in the worksheet grid, making formulas easier to audit, combine with other dynamic-array functions, and reuse in dashboard models. Microsoft also stresses that PIVOTBY is not directly connected to the PivotTable feature, despite the similar output.
That distinction matters when the source data changes.
As reported by How-To Geek, PIVOTBY results can expand and contract correctly after a dataset refresh while the corresponding conditional-formatting rules remain tied to a static cell range. In practice, a report can gain new rows that are not highlighted, or retain formatting in cells where results previously appeared.
Dynamic arrays support spill references such as
This is less of a concern for exploratory analysis, one-off summaries, or formula-driven back-end models. It becomes visible in shared workbooks where color scales, threshold alerts, data bars, or exception highlights are part of the report’s usability.
That structural connection means a properly scoped rule can survive common PivotTable changes, including filtering, collapsing or expanding levels, and moving fields. PivotTable options also include a “Preserve cell formatting on update” setting for maintaining layout and formatting during updates.
For Windows users and IT staff maintaining operational spreadsheets, this makes conventional PivotTables the safer choice when reports refresh frequently and visual cues are part of the deliverable. PIVOTBY remains useful where formula transparency, composability, and grid-native output matter more than presentation persistence.
The limitation is not a calculation failure, but a formatting-maintenance tradeoff that remains relevant in current Excel builds.
PIVOTBY is Microsoft’s formula-based tool for grouping, aggregating, sorting, and filtering data across row and column axes. It can produce PivotTable-like summaries directly in the worksheet grid, making formulas easier to audit, combine with other dynamic-array functions, and reuse in dashboard models. Microsoft also stresses that PIVOTBY is not directly connected to the PivotTable feature, despite the similar output.
That distinction matters when the source data changes.
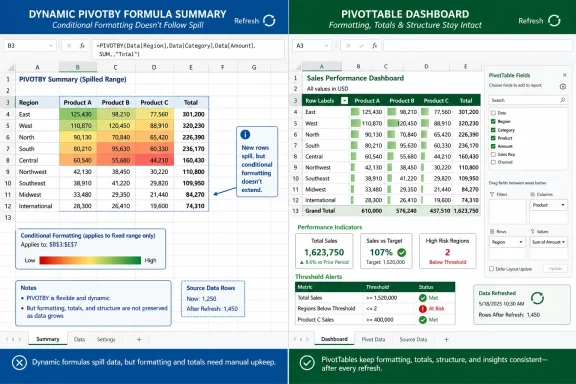 Dynamic results, fixed formatting
As reported by How-To Geek, PIVOTBY results can expand and contract correctly after a dataset refresh while the corresponding conditional-formatting rules remain tied to a static cell range. In practice, a report can gain new rows that are not highlighted, or retain formatting in cells where results previously appeared.Dynamic arrays support spill references such as
A1#, but the report found that using those references in the Conditional Formatting “Applies to” box does not preserve a live spill-range relationship. Excel reportedly converts the entry into an ordinary fixed-range reference when the rule is saved. Named ranges based on spill formulas do not fully solve that limitation for conditional formatting either.This is less of a concern for exploratory analysis, one-off summaries, or formula-driven back-end models. It becomes visible in shared workbooks where color scales, threshold alerts, data bars, or exception highlights are part of the report’s usability.
Why PivotTables still have the edge
PivotTables have conditional-formatting options that are aware of report structure rather than only cell addresses. Microsoft’s documentation says formatting in a PivotTable Values area can be scoped by selection, corresponding field, or value field. That allows a rule to be applied to all cells for a value field, or only to the equivalent field level while excluding subtotals and grand totals.That structural connection means a properly scoped rule can survive common PivotTable changes, including filtering, collapsing or expanding levels, and moving fields. PivotTable options also include a “Preserve cell formatting on update” setting for maintaining layout and formatting during updates.
For Windows users and IT staff maintaining operational spreadsheets, this makes conventional PivotTables the safer choice when reports refresh frequently and visual cues are part of the deliverable. PIVOTBY remains useful where formula transparency, composability, and grid-native output matter more than presentation persistence.
Practical choice
Use PIVOTBY for flexible calculations and dynamic report layers; retain PivotTables for dashboards or templates that depend on conditional formatting remaining correct after refreshes.The limitation is not a calculation failure, but a formatting-maintenance tradeoff that remains relevant in current Excel builds.
References
- Primary source: How-To Geek
Published: 2026-07-12T11:30:16+00:00
I love Excel's PIVOTBY function—but this one feature keeps me using PivotTables
PIVOTBY is great for analysis, but PivotTables still have the edge when formatting needs to adapt to data changes. www.howtogeek.com
- Official source: support.microsoft.com