

Microsoft Excel has changed far more than its familiar grid of cells suggests, and anyone returning after years with Google Sheets, LibreOffice Calc, or an older perpetual Office release may find that the modern app behaves like a substantially different productivity platform. Formulas can now fill entire result sets automatically, lookups are less brittle, cells can contain checkboxes and pictures, and advanced analysis can reach into Python and AI-assisted workflows without requiring a separate application.
The transformation matters because Excel’s older limitations shaped how generations of users worked. People copied formulas down thousands of rows, built lookup expressions around fixed column numbers, created awkward helper columns, and treated the spreadsheet as a static page rather than a responsive model. Current Microsoft 365 Excel still supports those established methods, which is important for compatibility, but it increasingly rewards more dynamic approaches.
For Windows users returning to Excel, the surprise is not that Microsoft has added a handful of new buttons. It is that the application’s core assumptions have shifted. A formula no longer has to mean “one output in one cell,” a worksheet no longer has to be text and numbers only, and a sophisticated analysis no longer has to leave the workbook.
The biggest conceptual adjustment for returning users is dynamic arrays. In classic Excel, a formula was normally entered into one cell and returned one result. If a calculation needed to apply to hundreds of records, users copied it down a column with the fill handle or created an Excel Table so formulas would propagate automatically.
That workflow still works. It is not obsolete, and Tables remain one of Excel’s best organizational features. But modern Excel can often calculate an entire range from one formula.
This is particularly useful for tasks such as:
can create a live alphabetical list of departments from a source table. Add a new department to the table, and the list updates automatically. In older Excel, this kind of output commonly required helper columns, an Advanced Filter, a PivotTable, or a much more complicated array formula.
That is not a flaw in the feature. It is Excel telling the user that the formula has more results than it has room to display. Still, it can catch returning users off guard, especially in workbooks designed around densely packed manual calculations.
The practical lesson is straightforward: leave space around formulas designed to spill, avoid putting unrelated entries beneath them, and use structured Tables for stable source data. A dynamic output can be extraordinarily clean, but only when the sheet is designed to accommodate it.
For example,
There is a trade-off. A carefully designed
VLOOKUP required users to specify the return column using a number. If the required value was in the fourth column of the lookup range, the formula needed a
A basic example looks like this:
This asks Excel to find the SKU from
The advantages are significant:
Modern Excel adds
The most important takeaway for returning users is simple: learn XLOOKUP first. Keep VLOOKUP knowledge for maintaining legacy files, but stop building new models around fixed column numbers unless compatibility with an old Excel version demands it.
That barrier has softened.
The distinction is important. A formula-generated result remains connected to the source data. If the underlying names change, the derived values can update rather than becoming a static paste operation.
This can be especially useful for common text-cleaning tasks:
That makes it potentially valuable for users who are comfortable describing a goal but rusty on syntax. A request such as “create a column that calculates gross margin” may produce a usable starting formula and an explanation of how it works.
However, this is an area where caution is essential. AI-generated formulas can be plausible and still be wrong. Copilot may misunderstand a column, make an incorrect assumption about missing values, or choose logic that is inappropriate for the business rule.
The responsible workflow is:
Large spreadsheets can be hard to navigate. Users often lose track of the active row while scrolling across wide reports, struggle to locate a key range in a workbook filled with sheets and tables, or spend too much time moving between scattered sections.
This is not a substitute for strong workbook design. Freeze Panes, clear headers, Tables, sensible column widths, consistent number formats, and restrained color use remain fundamental. But visual guidance can reduce fatigue in operational reports, inventories, schedules, and financial models that contain dozens of columns.
For anyone returning from an era when workbook navigation meant worksheet tabs, Name Box references, and keyboard shortcuts, this is a meaningful quality-of-life improvement. It is especially useful in shared workbooks that have grown organically and no longer have a simple structure.
The caveat is that navigation tools reveal a workbook’s structure; they do not fix poor structure. A file with unclear sheet names, hidden logic, duplicate data, and inconsistent layouts will still be difficult to maintain. Modern Excel makes better organization easier, but it cannot supply governance on its own.
Pictures were similarly troublesome. They sat on top of the worksheet rather than truly inside it, which created alignment problems when filters, sorting, resizing, or copying came into play.
A project tracker, for example, can use checkboxes to calculate completion percentage:
A task list can also use conditional formatting to gray out completed items when the checkbox cell evaluates to TRUE. This is simpler, cleaner, and more reliable than managing floating form controls.
Useful scenarios include:
When a picture is truly associated with a cell, it behaves more predictably with the table around it. Sort a product table and the associated image stays with the product record. Resize the row or column and the picture can remain tied to that position.
That does not mean every spreadsheet should become image-heavy. Embedded visual content can increase file size, slow down workbooks, complicate sharing, and reduce accessibility if alternative text is neglected. In-cell pictures are best used where the image supports a real decision or identification task—not merely to make a worksheet look more decorative.
This is a major departure from the traditional spreadsheet model. Instead of exporting data to a notebook, a local Python installation, or a separate analytics environment, users can combine Excel’s familiar interface with Python-based analysis.
Potential use cases include:
It also means local custom packages, unrestricted file access, arbitrary network calls, and desktop-specific Python configuration should not be assumed. The controlled environment improves security and consistency, but it limits flexibility compared with a full local development setup.
This matters for Windows users who expect Python in Excel to replace Jupyter notebooks, Visual Studio Code, or an enterprise data engineering environment. It can be an excellent analytical extension for a workbook, but it is not designed to be an unrestricted programming sandbox.
Before using it with sensitive information, teams should evaluate:
Features such as dynamic arrays, XLOOKUP, native checkboxes, advanced Copilot tools, Python integration, and newer formula functions may depend on the Excel version, Microsoft 365 subscription, update channel, operating system, or web experience in use.
A workbook can therefore behave differently when opened in:
This does not diminish the value of modern Excel. It simply means that feature availability is now part of spreadsheet design.
Yet Excel’s expanded capability also raises the stakes. Powerful formulas can be opaque, AI output can be inaccurate, cloud-connected features can introduce policy considerations, and version differences can create compatibility problems. The best modern workbook is not the one using the most new features; it is the one that uses the right features transparently and reliably.
For Windows users who abandoned Excel years ago, the application is worth reopening with fresh expectations. It remains a spreadsheet, but it is now also a dynamic calculation engine, a lightweight interactive workspace, an AI-assisted analysis surface, and—in the right environment—a bridge to Python-powered data work.
The transformation matters because Excel’s older limitations shaped how generations of users worked. People copied formulas down thousands of rows, built lookup expressions around fixed column numbers, created awkward helper columns, and treated the spreadsheet as a static page rather than a responsive model. Current Microsoft 365 Excel still supports those established methods, which is important for compatibility, but it increasingly rewards more dynamic approaches.
For Windows users returning to Excel, the surprise is not that Microsoft has added a handful of new buttons. It is that the application’s core assumptions have shifted. A formula no longer has to mean “one output in one cell,” a worksheet no longer has to be text and numbers only, and a sophisticated analysis no longer has to leave the workbook.
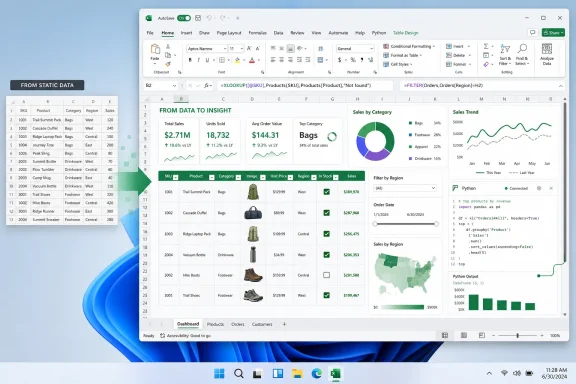 The Modern Excel Experience Starts With Dynamic Arrays
The biggest conceptual adjustment for returning users is dynamic arrays. In classic Excel, a formula was normally entered into one cell and returned one result. If a calculation needed to apply to hundreds of records, users copied it down a column with the fill handle or created an Excel Table so formulas would propagate automatically.That workflow still works. It is not obsolete, and Tables remain one of Excel’s best organizational features. But modern Excel can often calculate an entire range from one formula.
One Formula Can Produce a Whole List
A dynamic array formula begins in one cell and spills results into neighboring cells when the result contains multiple values. Rather than manually filling=A2*B2 through hundreds of rows, a modern formula can calculate a complete output array at once when the underlying function and reference support it.This is particularly useful for tasks such as:
- Filtering a master list by a condition
- Creating a unique customer, product, or employee list
- Sorting results without changing the original source table
- Returning multiple matching values from another range
- Reshaping data from rows into columns, or columns into rows
- Building dashboard outputs that expand and contract automatically
FILTERfor returning only rows that meet criteriaUNIQUEfor removing duplicates dynamicallySORTandSORTBYfor generating sorted result setsSEQUENCEfor producing incremental valuesTAKE,DROP,CHOOSECOLS, andCHOOSEROWSfor selecting parts of an arrayTOROWandTOCOLfor flattening data into a single row or column
=SORT(UNIQUE(Table1[Department]))can create a live alphabetical list of departments from a source table. Add a new department to the table, and the list updates automatically. In older Excel, this kind of output commonly required helper columns, an Advanced Filter, a PivotTable, or a much more complicated array formula.
The Spill Range Is Powerful—but It Introduces New Rules
Dynamic arrays remove repetitive work, but they also require a different kind of worksheet discipline. A spilled formula needs empty cells in its intended output area. If another value, formula, or object blocks the result, Excel returns a#SPILL! error.That is not a flaw in the feature. It is Excel telling the user that the formula has more results than it has room to display. Still, it can catch returning users off guard, especially in workbooks designed around densely packed manual calculations.
The practical lesson is straightforward: leave space around formulas designed to spill, avoid putting unrelated entries beneath them, and use structured Tables for stable source data. A dynamic output can be extraordinarily clean, but only when the sheet is designed to accommodate it.
Reusable Formula Logic Is No Longer Reserved for VBA
Excel’s modern formula language also includesLAMBDA, which lets users name a calculation and reuse it without writing a VBA macro. Combined with functions such as MAP, BYROW, BYCOL, REDUCE, and SCAN, it gives advanced users a way to construct reusable, function-like logic inside the workbook.For example,
BYCOL can apply a custom calculation to each column in a range. MAP can apply logic across corresponding values in one or more arrays. These are not features every casual user needs on day one, but they demonstrate how far Excel has moved beyond its old formula model.There is a trade-off. A carefully designed
LAMBDA can eliminate duplication and make a workbook more maintainable. A poorly documented one can make a spreadsheet difficult for the next person to understand. The best use case is not novelty; it is replacing repeated, well-defined logic with a clearly named formula.XLOOKUP Replaces One of Excel’s Most Frustrating Rituals
For many longtime Excel users, VLOOKUP is inseparable from spreadsheets. It was useful, widely taught, and capable of solving countless everyday lookup problems. It was also fragile.VLOOKUP required users to specify the return column using a number. If the required value was in the fourth column of the lookup range, the formula needed a
4. Insert a new column in the middle of that range and a previously correct formula could return the wrong data. VLOOKUP also searched from left to right, forcing users to rearrange source data or use more advanced alternatives when the desired return field sat to the left of the lookup key.Why XLOOKUP Feels Like the Formula Excel Should Have Had All Along
XLOOKUP modernizes the process. Instead of telling Excel to return “the fourth column,” users provide a lookup array and a return array directly.A basic example looks like this:
=XLOOKUP(A2,Products[SKU],Products[Price],"Not found")This asks Excel to find the SKU from
A2 in the Products[SKU] column and return the corresponding value from Products[Price]. The formula remains readable because its logic matches the question being asked.The advantages are significant:
- Exact match is the default, reducing a common VLOOKUP mistake
- Lookups can work left-to-right or right-to-left
- The return range is explicitly named rather than represented by a column index
- A custom result can appear when no match exists
- Search behavior can be configured for different scenarios
- The formula is more resilient when columns are moved or inserted
XMATCH Is the Modern Companion for Position-Based Logic
Users who learned to avoid VLOOKUP often adopted the classicINDEX + MATCH combination. It is still powerful and still valid, especially in older workbooks that must remain compatible with earlier Excel versions.Modern Excel adds
XMATCH, an upgraded matching function that returns the relative position of a value within a range. It supports exact matching by default and offers additional search and match modes. Used with INDEX, it provides a more flexible position-based lookup pattern.The most important takeaway for returning users is simple: learn XLOOKUP first. Keep VLOOKUP knowledge for maintaining legacy files, but stop building new models around fixed column numbers unless compatibility with an old Excel version demands it.
Excel Can Now Help Build Formulas Instead of Just Rejecting Them
Excel has traditionally been unforgiving to people who did not know the exact function name or syntax. A user might understand the desired result perfectly—extract a first name, calculate a percentage change, classify a status—but still have no obvious route from the question to the formula.That barrier has softened.
Formula by Example Recognizes Patterns
Formula by Example can identify patterns in values that users begin entering and suggest a formula to complete the rest of the column. For instance, if a column contains full names and a user manually types a few extracted first names beside them, Excel may recognize the pattern and offer a formula-based completion.The distinction is important. A formula-generated result remains connected to the source data. If the underlying names change, the derived values can update rather than becoming a static paste operation.
This can be especially useful for common text-cleaning tasks:
- Extracting first or last names
- Pulling IDs from formatted strings
- Splitting addresses or codes
- Standardizing labels
- Combining fields in a consistent way
Copilot Can Suggest, Explain, and Build Spreadsheet Logic
With an eligible Microsoft 365 and Copilot setup, Copilot in Excel can generate formula suggestions from natural-language instructions. It can also help create formula columns, summarize trends, build lookups, explain inherited formulas, and assist with changes to workbook content.That makes it potentially valuable for users who are comfortable describing a goal but rusty on syntax. A request such as “create a column that calculates gross margin” may produce a usable starting formula and an explanation of how it works.
However, this is an area where caution is essential. AI-generated formulas can be plausible and still be wrong. Copilot may misunderstand a column, make an incorrect assumption about missing values, or choose logic that is inappropriate for the business rule.
The responsible workflow is:
- Ask Copilot for a draft formula or approach.
- Read the formula rather than accepting it blindly.
- Test it against records where the expected answer is known.
- Check edge cases, blanks, errors, duplicate keys, and zero values.
- Confirm that the output agrees with the organization’s actual rules.
Small Windows Excel Improvements Make Large Workbooks Less Painful
Not every change in Excel is flashy. Some of the most valuable additions address the low-level irritation of working in complex worksheets all day.Large spreadsheets can be hard to navigate. Users often lose track of the active row while scrolling across wide reports, struggle to locate a key range in a workbook filled with sheets and tables, or spend too much time moving between scattered sections.
Better Visual Orientation in Dense Sheets
Newer navigation and focus-oriented tools are aimed at making Excel more manageable when a worksheet extends far beyond what fits on screen. Features such as Focus Cell can help make the active area easier to track, reducing the chance of entering data in the wrong row or reading across the wrong record.This is not a substitute for strong workbook design. Freeze Panes, clear headers, Tables, sensible column widths, consistent number formats, and restrained color use remain fundamental. But visual guidance can reduce fatigue in operational reports, inventories, schedules, and financial models that contain dozens of columns.
The Navigation Pane Helps Locate Workbook Elements
The Navigation pane provides a more structured way to move around substantial workbooks. Instead of repeatedly scrolling through sheets and hunting manually for key content, users can search and navigate through elements in the file.For anyone returning from an era when workbook navigation meant worksheet tabs, Name Box references, and keyboard shortcuts, this is a meaningful quality-of-life improvement. It is especially useful in shared workbooks that have grown organically and no longer have a simple structure.
The caveat is that navigation tools reveal a workbook’s structure; they do not fix poor structure. A file with unclear sheet names, hidden logic, duplicate data, and inconsistent layouts will still be difficult to maintain. Modern Excel makes better organization easier, but it cannot supply governance on its own.
Checkboxes and Pictures Have Finally Become First-Class Cell Content
Excel used to make interactivity awkward. To add a checkbox, users often enabled the Developer tab, inserted a form control, linked it to a cell, and adjusted a floating object that could shift when rows or columns changed.Pictures were similarly troublesome. They sat on top of the worksheet rather than truly inside it, which created alignment problems when filters, sorting, resizing, or copying came into play.
Native Checkboxes Make Task Tracking Practical
Modern Excel provides native checkboxes that live in cells. A checked box corresponds to TRUE, while an unchecked box corresponds to FALSE. That makes the checkbox more than visual decoration: it can directly feed formulas, conditional formatting, filters, and summary calculations.A project tracker, for example, can use checkboxes to calculate completion percentage:
=COUNTIF(B2:B20,TRUE)/COUNTA(B2:B20)A task list can also use conditional formatting to gray out completed items when the checkbox cell evaluates to TRUE. This is simpler, cleaner, and more reliable than managing floating form controls.
Useful scenarios include:
- Personal or team task lists
- Equipment inspections
- Approval checklists
- Event planning
- Employee onboarding
- Inventory verification
- Recurring operational procedures
In-Cell Images Keep Visual Data Attached to Records
Excel can also place pictures directly in cells. Users can convert an existing floating image to a cell-based image or use theIMAGE function in appropriate scenarios. The effect is much more natural when working with product lists, employee directories, property inventories, catalogs, asset records, or visual inspection sheets.When a picture is truly associated with a cell, it behaves more predictably with the table around it. Sort a product table and the associated image stays with the product record. Resize the row or column and the picture can remain tied to that position.
That does not mean every spreadsheet should become image-heavy. Embedded visual content can increase file size, slow down workbooks, complicate sharing, and reduce accessibility if alternative text is neglected. In-cell pictures are best used where the image supports a real decision or identification task—not merely to make a worksheet look more decorative.
Python in Excel Expands What “Spreadsheet Analysis” Can Mean
The most striking modern Excel feature for technical users is Python in Excel. It allows Python code to be entered in the Excel grid through Python formulas, with results returned to the worksheet.This is a major departure from the traditional spreadsheet model. Instead of exporting data to a notebook, a local Python installation, or a separate analytics environment, users can combine Excel’s familiar interface with Python-based analysis.
What Python Adds to a Workbook
Python in Excel can support data cleaning, statistical analysis, pattern discovery, and visualization using a curated environment that includes well-known libraries such as:- pandas
- NumPy
- Matplotlib
- seaborn
- statsmodels
Potential use cases include:
- Cleaning inconsistent text fields
- Exploring large structured datasets
- Creating statistical summaries
- Modeling distributions and trends
- Building custom visualizations
- Working with DataFrames alongside Excel Tables
- Performing repeatable transformations that exceed practical formula complexity
It Is Not a Local Python Replacement
Python in Excel has important boundaries. Python calculations run through Microsoft’s cloud-connected environment rather than a user’s local Python installation. This means internet access and a qualifying license are part of the experience, and not every platform offers the same capability.It also means local custom packages, unrestricted file access, arbitrary network calls, and desktop-specific Python configuration should not be assumed. The controlled environment improves security and consistency, but it limits flexibility compared with a full local development setup.
This matters for Windows users who expect Python in Excel to replace Jupyter notebooks, Visual Studio Code, or an enterprise data engineering environment. It can be an excellent analytical extension for a workbook, but it is not designed to be an unrestricted programming sandbox.
Cloud Processing Requires a Data Governance Conversation
Organizations should also understand the implications of cloud-based calculation. Python in Excel is designed with enterprise security controls and isolated processing, but the feature still represents a connected service rather than a purely offline workbook function.Before using it with sensitive information, teams should evaluate:
- Microsoft 365 licensing and tenant policies
- Data residency and compliance requirements
- Whether connected experiences are permitted
- Workbook-sharing and access controls
- Whether users understand the calculation environment
- Reproducibility and documentation requirements
Compatibility Still Matters More Than Excitement
The modern Excel feature set is impressive, but it is not distributed equally across every version and platform. This is the most important practical limitation for anyone reopening old files or collaborating with people who use different software.Features such as dynamic arrays, XLOOKUP, native checkboxes, advanced Copilot tools, Python integration, and newer formula functions may depend on the Excel version, Microsoft 365 subscription, update channel, operating system, or web experience in use.
A workbook can therefore behave differently when opened in:
- A current Microsoft 365 desktop installation
- Excel for the web
- An older perpetual Excel release
- A mobile Excel app
- Another spreadsheet program
- A corporate environment with restricted connected features
This does not diminish the value of modern Excel. It simply means that feature availability is now part of spreadsheet design.
Excel Is More Capable, but Better Habits Still Win
Returning to Excel today can feel like discovering a familiar tool that has quietly become much more ambitious. Dynamic arrays remove repetitive formula filling. XLOOKUP reduces fragile lookup patterns. Native checkboxes and in-cell pictures make worksheets more interactive. Formula suggestions and Copilot lower the entry barrier. Python extends the grid into serious analytical territory.Yet Excel’s expanded capability also raises the stakes. Powerful formulas can be opaque, AI output can be inaccurate, cloud-connected features can introduce policy considerations, and version differences can create compatibility problems. The best modern workbook is not the one using the most new features; it is the one that uses the right features transparently and reliably.
For Windows users who abandoned Excel years ago, the application is worth reopening with fresh expectations. It remains a spreadsheet, but it is now also a dynamic calculation engine, a lightweight interactive workspace, an AI-assisted analysis surface, and—in the right environment—a bridge to Python-powered data work.
References
- Primary source: How-To Geek
Published: 2026-07-23T11:30:12+00:00
Loading…
www.howtogeek.com