Use Performance Monitor Data Collector Sets to Track and Fix Slowdowns in Windows 10/11
Difficulty: Intermediate | Time Required: 20 minutesIf your PC feels slow only at certain times—during gaming, startup, file copies, backups, or while a browser has too many tabs open—it can be hard to catch the real cause in the act. Task Manager is helpful for live checks, but it doesn’t always tell the full story after the slowdown has passed.
That’s where Performance Monitor Data Collector Sets come in. They let you record CPU, memory, disk, and other performance counters over time so you can review exactly what was happening when your system slowed down. This is especially useful on Windows 10 and Windows 11, where intermittent slowdowns are often caused by background apps, storage bottlenecks, memory pressure, or driver-related activity spikes.
Prerequisites
Before you begin, make sure you have:Quick walkthrough
- A Windows 10 or Windows 11 PC
- An account with administrator privileges
- A few minutes to reproduce the slowdown
- Enough free disk space for log files
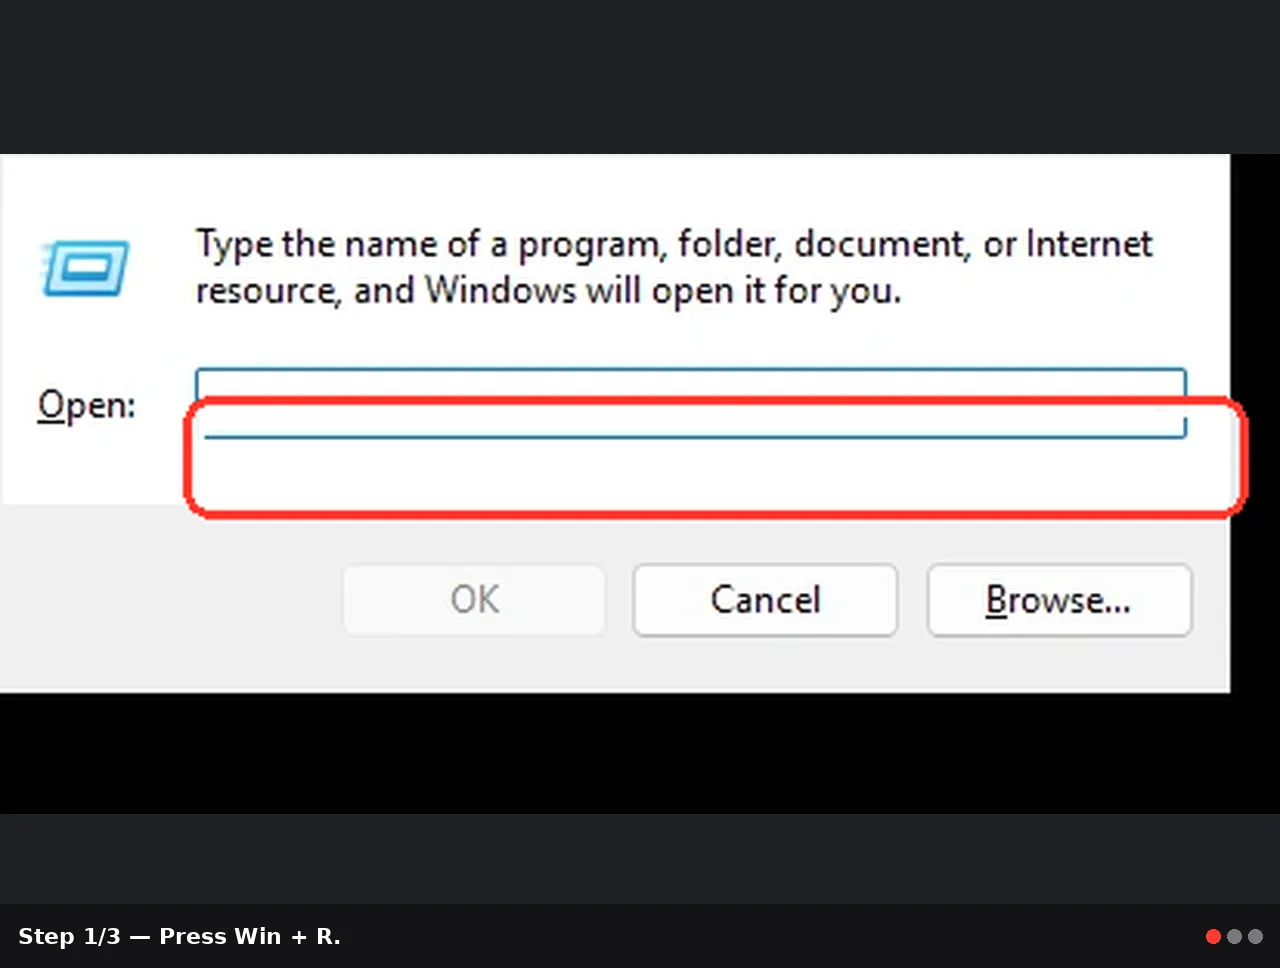
Note: Performance Monitor is built into both Windows 10 and Windows 11. You can launch it by pressing Win + R, typingperfmon, and pressing Enter.
Version note: The interface is very similar in Windows 10 and Windows 11. Menu names and counter categories may vary slightly depending on build version and installed hardware.
Step 1: Open Performance Monitor
- Press Win + R.
- Type
perfmonand press Enter. - In the left pane, expand Data Collector Sets.
- Expand User Defined.
This is where you can create your own custom logging set.
Tip: You may also see built-in System or Event Trace sets. For troubleshooting slowdowns, a custom set under User Defined is usually easiest to manage.
Step 2: Create a New Data Collector Set
- Right-click User Defined.
- Select New > Data Collector Set.
- Give it a clear name, such as Slowdown Trace.
- Choose Create manually (Advanced).
- Click Next.
Step 3: Choose Performance Counters
- Select Create data logs.
- Check Performance counter.
- Click Next.
- Click Add.
Recommended counters
Add some or all of the following:Processor
- Processor(_Total)\% Processor Time
- System\Processor Queue Length
Memory
- Memory\Available MBytes
- Memory\Pages/sec
Disk
- PhysicalDisk(_Total)\% Disk Time
- PhysicalDisk(_Total)\Avg. Disk Queue Length
- PhysicalDisk(_Total)\Disk Bytes/sec
System responsiveness
- System\Context Switches/sec
- Process(your app)\% Processor Time if you suspect a specific app
- Click Add >> for each counter you want.
- Click OK when finished.
Tip: Start with a small set of counters first. Too many counters can make analysis harder and create larger logs.
Warning: Some counters are instance-based. For example, under Process, you may see multiple app names or several entries for similar processes. Choose carefully if you want app-specific tracking.
Step 4: Set the Sample Interval
- In the wizard, set the Sample interval.
- A good starting point is 5 seconds.
- Click Next.
How to choose the interval
- 1 second: better for short, sudden spikes, but larger logs
- 5 seconds: best all-around choice for most users
- 15–30 seconds: fine for long-term monitoring
Important: Microsoft notes that Windows Performance Counters are intended for administrative and diagnostic collection, not extremely high-frequency profiling. In general, don’t try to collect them faster than once per second.
Step 5: Choose the Log Location
- Choose where to save the log files.
- The default location usually works, but you can browse to another folder if preferred.
- Click Next.
Step 6: Save and Finish
- Choose Save and close.
- Click Finish.
Step 7: Start Logging
- Right-click your new Slowdown Trace set.
- Click Start.
- Use your PC normally.
- Reproduce the slowdown if possible—open the app, run the task, or wait for the issue to occur.
- Let logging continue for a few minutes during and after the slowdown.
- Right-click the Data Collector Set again.
- Click Stop.
Step 8: Review the Collected Data
There are a few ways to review what you captured.Option A: View the report inside Performance Monitor
- In the left pane, expand Reports.
- Expand User Defined.
- Click your Slowdown Trace report.
Option B: Open the log in Performance Monitor
- Click Performance Monitor in the left pane.
- Right-click the graph and choose Properties.
- Go to the Source tab.
- Select Log files.
- Add the file created by your Data Collector Set.
Step 9: Interpret the Results
Here’s what common patterns usually mean:High CPU usage
- % Processor Time stays near 90–100%
- Processor Queue Length rises
- A runaway background process
- Antivirus scanning
- Browser tabs or extensions
- Driver or service issues
Low available memory
- Available MBytes drops very low
- Pages/sec spikes repeatedly
- Too many apps open
- Memory leak in an app
- Heavy browser usage
- Insufficient RAM
Disk bottleneck
- % Disk Time remains high
- Avg. Disk Queue Length grows
- System feels frozen during file access
- Slow HDD or stressed SSD
- Windows Search indexing
- Updates, backup software, or sync tools
- Storage driver problems
App-specific slowdown
If a specific Process\% Processor Time counter spikes while the PC slows down, that app may be the trigger.Tip: Look for counters that spike at the exact same time the slowdown happened. Correlation is the key benefit of using Data Collector Sets.
Step 10: Apply Fixes Based on What You Found
Once you identify the bottleneck, try the matching fix:If CPU is the problem
- Open Task Manager and sort by CPU.
- Disable unnecessary startup apps.
- Update the affected application.
- Check for malware or excessive background scans.
- Install Windows and driver updates.
If memory is the problem
- Close unused apps and browser tabs.
- Restart the app that is consuming too much RAM.
- Check startup programs.
- Consider increasing virtual memory if it has been manually limited.
- Upgrade RAM if the issue is frequent.
If disk is the problem
- Check drive health with SMART tools or the manufacturer utility.
- Make sure there is sufficient free space.
- Pause heavy syncing or backup jobs temporarily.
- Update storage and chipset drivers.
- If you’re still on an HDD, moving Windows to an SSD can provide a dramatic improvement.
Tips and Troubleshooting Notes
Useful built-in shortcut
You can also use:perfmon /reportThis starts the System Diagnostics Data Collector Set and generates a report automatically. It’s a great quick-check option before building your own custom set.
Command-line management
Advanced users can also manage collectors with:logmanThis command can create, start, stop, import, and export performance logging sets from the command line.
If counters are missing
- Run Performance Monitor as Administrator
- Restart the PC
- Check whether the counter category exists on your system
- Some counters vary by hardware, drivers, or Windows version
If the log is too large
- Increase the sample interval
- Reduce the number of counters
- Capture only during the problem period
If the report doesn’t make sense
- Repeat the test while reproducing only one issue at a time
- Avoid changing too many system settings between captures
- Compare one “slow” session to one “normal” session
Warning: Don’t leave a high-frequency Data Collector Set running indefinitely unless you really need it. It can consume storage and make later analysis more difficult.
Conclusion
Performance Monitor Data Collector Sets are one of the best built-in tools for diagnosing Windows slowdowns because they let you capture what happened over time instead of guessing afterward. With a small set of well-chosen counters, you can quickly tell whether the real issue is CPU load, low memory, disk congestion, or a misbehaving app.Once you know the bottleneck, fixing the slowdown becomes much more straightforward—and much less frustrating.
Key Takeaways:
- Data Collector Sets let you record performance data during real slowdowns
- They help identify whether CPU, memory, disk, or a specific app is causing the issue
- A 5-second sample interval is a practical starting point for most Windows 10/11 users
- Built-in tools like
perfmonandperfmon /reportmake troubleshooting easier without third-party software - Captured logs give you evidence you can use to apply targeted fixes instead of guessing
This tutorial was generated to help WindowsForum.com users get the most out of their Windows experience.
Last edited: