

Your SSD may be giving Windows all the evidence needed to warn about trouble, yet most PCs never show it in a form that is useful to ordinary users. The health data is already there: flash wear estimates, lifetime writes, operating temperature, unsafe shutdowns, spare-block status, and media errors. The problem is not that modern solid-state drives are silent. It is that Windows usually reduces a complex set of vendor and protocol-level telemetry into a reassuringly vague status such as Healthy—until the moment it cannot.
That makes SSD monitoring one of the most misunderstood parts of Windows PC maintenance. Users are often trained to watch free space, benchmark scores, and perhaps a single “health” percentage in a utility, while the details that can actually identify a developing issue remain buried in SMART data. Understanding those details does not require turning every Windows 11 installation into a storage lab. It does, however, require looking beyond one oversized number.
Traditional hard disk drives fail through a mix of mechanical wear, bearing problems, head crashes, platter damage, and electronics failures. SSDs eliminate spinning media and moving read/write heads, making them faster, quieter, and far less vulnerable to physical shock. But solid-state storage is not immortal.
An SSD stores data in NAND flash cells. Those cells must be programmed and erased as data changes, and each cell type has a finite endurance range. The drive’s controller works constantly to spread writes across the NAND, correct errors, move aging data, manage spare capacity, and retire weak blocks before they become a direct problem.
This process is largely invisible to Windows. The operating system sees a fast block device and focuses on whether it can still read and write data. The SSD itself sees a much richer picture:
The catch is that SMART was never designed as a universal, consumer-friendly health score. It is a set of diagnostic data points, some standardized and others vendor-specific. That is why interpreting SSD SMART data requires context rather than panic.
For example, an elevated PowerShell window can retrieve basic drive details with:
For more detailed reliability counters, Windows includes:
Depending on the SSD, controller, driver, enclosure, and connection method, this may reveal values including:
More importantly, PowerShell shows raw fields without doing much to help users understand whether a value is normal, vendor-specific, historical, or genuinely alarming. A third-party utility can therefore be more practical for routine checks.
The utility’s value is not simply that it displays a green, yellow, or red status label. Its real advantage is that it puts a large amount of raw information in one readable window:
That said, no monitoring tool can turn incomplete telemetry into a certainty. If a drive does not reveal a value, a blank field is not proof that the underlying component is healthy. It only means that the tool could not obtain that particular metric.
On a Windows system with smartmontools installed, an elevated terminal can begin by scanning for compatible devices:
The command normally identifies the drive path that smartctl can query. For many NVMe drives, a detailed report can then be requested with a command resembling:
Exact device naming depends on the Windows environment and driver stack, so it is important to use the result from
Windows 11’s Sudo for Windows feature can run supported commands with elevation where it is available and enabled, but it is not a requirement for SSD diagnostics. Running an elevated Command Prompt, Windows Terminal, or PowerShell session is sufficient. This distinction matters because Sudo for Windows is not present on every Windows version or configuration.
A drive showing 98% health may have very little wear and be operating normally. A drive showing 72% health may still have years of ordinary use ahead of it. Conversely, a drive at 100% health can still experience a controller failure, firmware defect, power event, connection issue, or an early-life hardware fault.
On NVMe drives, the standardized Percentage Used field is a vendor estimate of consumed endurance. It is commonly interpreted as an estimate of how much of the drive’s rated lifetime has been used. It is not a countdown clock, a warranty meter, or a prediction that a drive will fail immediately when it reaches 100%.
The number can be useful as a broad baseline. It becomes much more meaningful when paired with actual lifetime writes and the drive’s published endurance specification, typically expressed as TBW—terabytes written.
There are also several failure modes that the wear number does not capture well:
A falling health figure is not automatically alarming. A supposedly perfect score is not a guarantee. The right approach is to treat it as one input in a wider health check.
For SATA SSDs, a utility might display the number directly in gigabytes or terabytes. On NVMe drives, the underlying field may be shown as Data Units Written. Tools often convert that counter into a human-readable TB value.
This matters because it lets users compare real usage with the endurance rating of the specific SSD model. A 1TB drive rated for 600TBW that has recorded 30TB of host writes has experienced a very different workload from a 1TB drive that has written 500TB.
However, TBW must not be treated as a hard expiration date. It is generally a rated endurance threshold and warranty criterion, not a promise that the drive stops functioning at the stated number. Drives can exceed their rating, but users should not rely on that outcome for important data.
This field is especially useful when evaluating a used SSD. It can also catch an unexpected mismatch between a drive’s claimed condition and its actual operating history.
Do not overreact to high hours alone. An SSD used for years without errors, thermal problems, or abnormal wear may be entirely serviceable. The field is context, not a verdict.
A momentary rise in temperature is not necessarily harmful. Modern NVMe drives are engineered to throttle when necessary. The more useful question is whether the drive repeatedly spends significant time at elevated temperatures, triggers warning thresholds, or suffers noticeable slowdowns under ordinary workloads.
Pay attention to:
The important distinction is between brief peaks and persistent heat. A single warm benchmark result is less concerning than regular thermal throttling during normal work.
A drive with ample available spare capacity is behaving normally. A reading below the threshold deserves immediate attention, even if the drive remains readable and the health percentage looks less dramatic than expected.
This is one of the areas where SMART data provides a clearer warning than a generic Windows health status. Loss of spare capacity suggests the drive has less room to absorb future block failures.
A small nonzero number is not always a disaster. SSDs are designed to manage NAND imperfections internally, and some vendor reporting conventions can make interpretation difficult. What matters most is the trend.
A counter that remains stable over months may simply reflect normal management or factory-tested behavior. A counter that rises repeatedly is a warning that the SSD is consuming reserve resources and may be deteriorating.
The practical rule is straightforward: watch for change, not merely the presence of a number.
A nonzero count does not always mean the drive is actively failing at that moment. The event could be historical, and storage logs must be read in context. But a count that increases—particularly alongside freezes, blue screens, missing files, read errors, or Event Viewer storage messages—is a strong reason to protect data immediately.
When this counter rises, do not spend days attempting to diagnose the drive while important files exist only on that device. Back up or clone first. Troubleshoot afterward.
A corrected error is not necessarily a crisis; error correction is a normal part of flash management. An uncorrectable error means the correction process was unable to fully recover the requested data. Repeated uncorrectable events are not normal wear telemetry to ignore.
The counter alone does not prove data loss or SSD damage. It does, however, tell an important story. A rapidly increasing number can point to system stability problems, accidental power interruptions, or poor power behavior from a USB enclosure.
For desktop PCs, a quality power supply and a UPS can reduce avoidable risk. For laptops, persistent crashes and unexpected battery depletion should be investigated rather than dismissed as routine Windows annoyances.
Still, a rising count is useful when correlated with symptoms. If Windows begins logging disk resets, controller timeouts, or NVMe event warnings while this figure climbs, the SSD, its firmware, motherboard slot, cooling, or driver environment deserves attention.
Windows users should combine SMART information with actual behavior. Warning signs include:
That is another reason not to treat a single SMART field as conclusive evidence. Storage diagnosis is strongest when SMART trends, Windows logs, performance behavior, and hardware checks point in the same direction.
Focus on whether key fields changed:
Before applying any SSD firmware update:
SSDs may fail gradually, but they can also fail abruptly. A controller or firmware problem may make a previously fast drive vanish before wear metrics suggest an obvious end-of-life scenario.
A sound Windows backup strategy should include more than one layer:
It also helps prevent unnecessary replacement. A five-year-old NVMe SSD with moderate writes, normal temperatures, no media errors, sufficient spare capacity, and stable SMART counters may still be a perfectly sensible system drive. Age alone does not condemn solid-state storage.
The limitation is that SMART is not a universal failure-prediction engine. Vendor-specific attributes vary, not every connection method exposes complete data, and not every failure announces itself through a rising counter. A green status indicator is useful reassurance, but it is not a guarantee.
The best Windows SSD health practice is therefore balanced rather than obsessive: inspect the data occasionally, understand the counters that reflect genuine risk, react quickly to trends and symptoms, keep firmware sensible, and maintain backups that make drive failure inconvenient rather than catastrophic.
When an SSD is quietly telling the system something is wrong, the objective is not to become a full-time PC mechanic. It is to notice the difference between normal lifetime use and evidence of deterioration early enough to preserve the data that matters.
That makes SSD monitoring one of the most misunderstood parts of Windows PC maintenance. Users are often trained to watch free space, benchmark scores, and perhaps a single “health” percentage in a utility, while the details that can actually identify a developing issue remain buried in SMART data. Understanding those details does not require turning every Windows 11 installation into a storage lab. It does, however, require looking beyond one oversized number.
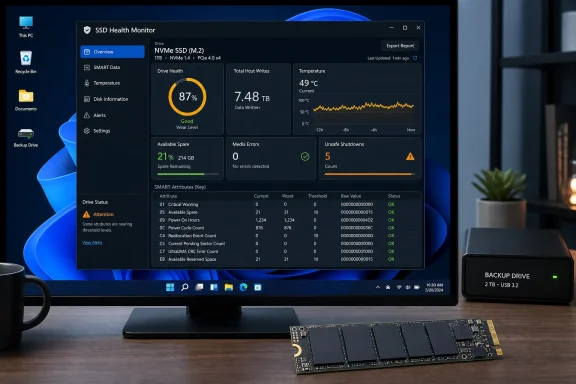 Background: SSDs Wear Differently From Hard Drives
Traditional hard disk drives fail through a mix of mechanical wear, bearing problems, head crashes, platter damage, and electronics failures. SSDs eliminate spinning media and moving read/write heads, making them faster, quieter, and far less vulnerable to physical shock. But solid-state storage is not immortal.An SSD stores data in NAND flash cells. Those cells must be programmed and erased as data changes, and each cell type has a finite endurance range. The drive’s controller works constantly to spread writes across the NAND, correct errors, move aging data, manage spare capacity, and retire weak blocks before they become a direct problem.
This process is largely invisible to Windows. The operating system sees a fast block device and focuses on whether it can still read and write data. The SSD itself sees a much richer picture:
- How much data the host has written over the drive’s life
- How long the controller has been powered
- How often the drive has been started or shut down unexpectedly
- Whether blocks have been retired or reallocated
- Whether read or write errors were corrected internally
- Whether uncorrectable media errors have reached the host
- How often the drive has spent time above temperature thresholds
- How much manufacturer-estimated endurance has been consumed
The catch is that SMART was never designed as a universal, consumer-friendly health score. It is a set of diagnostic data points, some standardized and others vendor-specific. That is why interpreting SSD SMART data requires context rather than panic.
Windows Does Not Completely Hide SSD Health—But It Does Not Explain It Well
The claim that Windows hides SSD health signs is directionally correct, even if it is slightly too absolute. Windows includes storage health reporting, and modern versions can retrieve reliability information from drives that expose it correctly. PowerShell can report fields such as temperature, errors, wear, and power-on time.For example, an elevated PowerShell window can retrieve basic drive details with:
Get-PhysicalDisk | Format-Table FriendlyName, MediaType, HealthStatus, OperationalStatus, SizeFor more detailed reliability counters, Windows includes:
Get-PhysicalDisk | Get-StorageReliabilityCounter | Format-ListDepending on the SSD, controller, driver, enclosure, and connection method, this may reveal values including:
TemperatureTemperatureMaxWearPowerOnHoursReadErrorsTotalReadErrorsUncorrectedWriteErrorsTotalWriteErrorsUncorrected- Read, write, and flush latency information
More importantly, PowerShell shows raw fields without doing much to help users understand whether a value is normal, vendor-specific, historical, or genuinely alarming. A third-party utility can therefore be more practical for routine checks.
CrystalDiskInfo Remains the Easiest Windows Starting Point
For Windows users, CrystalDiskInfo remains one of the simplest ways to inspect SSD SMART information without learning storage commands. It supports many SATA, NVMe, and USB-connected drives, although compatibility can vary by controller and enclosure.The utility’s value is not simply that it displays a green, yellow, or red status label. Its real advantage is that it puts a large amount of raw information in one readable window:
- Drive model and firmware revision
- Interface and transfer mode
- Current temperature
- Power-on hours
- Power cycle count
- Total host reads and writes
- NVMe percentage used
- Available spare capacity
- Reallocated or retired blocks where supported
- Media and data integrity error counts
- Unsafe shutdown counts
- Vendor-specific SSD attributes
That said, no monitoring tool can turn incomplete telemetry into a certainty. If a drive does not reveal a value, a blank field is not proof that the underlying component is healthy. It only means that the tool could not obtain that particular metric.
The Command-Line Alternative: smartctl
More advanced users can use smartctl, part of the smartmontools package. It is particularly useful for scripts, remote management, and saving baseline reports over time.On a Windows system with smartmontools installed, an elevated terminal can begin by scanning for compatible devices:
smartctl --scanThe command normally identifies the drive path that smartctl can query. For many NVMe drives, a detailed report can then be requested with a command resembling:
smartctl -a /dev/nvme0Exact device naming depends on the Windows environment and driver stack, so it is important to use the result from
smartctl --scan rather than blindly copying a device path.Windows 11’s Sudo for Windows feature can run supported commands with elevation where it is available and enabled, but it is not a requirement for SSD diagnostics. Running an elevated Command Prompt, Windows Terminal, or PowerShell session is sufficient. This distinction matters because Sudo for Windows is not present on every Windows version or configuration.
The “Health Percentage” Is Helpful, but It Is Not the Whole Diagnosis
Many SSD utilities make the health percentage the most visible figure on screen. That is understandable: a single percentage feels intuitive. Unfortunately, it also encourages the wrong kind of thinking.A drive showing 98% health may have very little wear and be operating normally. A drive showing 72% health may still have years of ordinary use ahead of it. Conversely, a drive at 100% health can still experience a controller failure, firmware defect, power event, connection issue, or an early-life hardware fault.
On NVMe drives, the standardized Percentage Used field is a vendor estimate of consumed endurance. It is commonly interpreted as an estimate of how much of the drive’s rated lifetime has been used. It is not a countdown clock, a warranty meter, or a prediction that a drive will fail immediately when it reaches 100%.
The number can be useful as a broad baseline. It becomes much more meaningful when paired with actual lifetime writes and the drive’s published endurance specification, typically expressed as TBW—terabytes written.
Why a Percentage Can Mislead
Health percentages are calculated according to the SSD maker’s firmware logic. Manufacturers may use different NAND configurations, spare-area policies, wear-leveling algorithms, endurance criteria, and reporting conventions. Two drives with identical amounts of host writes can therefore report different wear percentages.There are also several failure modes that the wear number does not capture well:
- Controller failure
- Firmware corruption or defects
- DRAM or cache issues
- Power-loss-related corruption
- PCIe connection instability
- Overheating
- Bad motherboard M.2 slot contact
- USB bridge or enclosure failures
- Sudden media errors unrelated to expected NAND wear
A falling health figure is not automatically alarming. A supposedly perfect score is not a guarantee. The right approach is to treat it as one input in a wider health check.
The SMART Values That Matter Most
The best way to read SSD SMART data is to separate ordinary evidence of use from counters that indicate actual trouble. A busy workstation SSD will naturally accumulate writes, hours, cycles, and perhaps some corrected internal errors. The concern begins when critical counters appear, climb, or coincide with real-world symptoms.Total Host Writes and Data Units Written
Total Host Writes is one of the most useful lifetime figures. It shows how much data the operating system and applications have sent to the drive.For SATA SSDs, a utility might display the number directly in gigabytes or terabytes. On NVMe drives, the underlying field may be shown as Data Units Written. Tools often convert that counter into a human-readable TB value.
This matters because it lets users compare real usage with the endurance rating of the specific SSD model. A 1TB drive rated for 600TBW that has recorded 30TB of host writes has experienced a very different workload from a 1TB drive that has written 500TB.
However, TBW must not be treated as a hard expiration date. It is generally a rated endurance threshold and warranty criterion, not a promise that the drive stops functioning at the stated number. Drives can exceed their rating, but users should not rely on that outcome for important data.
Power-On Hours
Power-On Hours tells the story of time rather than write volume. A drive with 20,000 hours of operation and low writes may have spent years in light desktop use. Another drive with 2,000 hours and very high writes may have been subjected to intense compiling, video editing, virtual machine workloads, database activity, caching, or file-transfer use.This field is especially useful when evaluating a used SSD. It can also catch an unexpected mismatch between a drive’s claimed condition and its actual operating history.
Do not overreact to high hours alone. An SSD used for years without errors, thermal problems, or abnormal wear may be entirely serviceable. The field is context, not a verdict.
Temperature and Thermal History
Temperature is a major SSD health and performance factor, especially for NVMe SSDs mounted directly on a motherboard. Compact M.2 drives can run hot during sustained writes, game installation, content creation, file transfers, or heavy background activity.A momentary rise in temperature is not necessarily harmful. Modern NVMe drives are engineered to throttle when necessary. The more useful question is whether the drive repeatedly spends significant time at elevated temperatures, triggers warning thresholds, or suffers noticeable slowdowns under ordinary workloads.
Pay attention to:
- Current composite temperature
- Individual sensor readings, if available
- Warning temperature time
- Critical temperature time
- Thermal-management event counts
- Repeated performance drops during sustained activity
The important distinction is between brief peaks and persistent heat. A single warm benchmark result is less concerning than regular thermal throttling during normal work.
Available Spare and Spare Threshold
NVMe drives maintain a pool of spare NAND capacity. When flash blocks become unreliable, the controller can retire them and substitute reserve blocks. The Available Spare metric reflects the remaining reserve, while Available Spare Threshold identifies the level at which the drive considers the situation concerning.A drive with ample available spare capacity is behaving normally. A reading below the threshold deserves immediate attention, even if the drive remains readable and the health percentage looks less dramatic than expected.
This is one of the areas where SMART data provides a clearer warning than a generic Windows health status. Loss of spare capacity suggests the drive has less room to absorb future block failures.
Reallocated, Retired, or Grown Bad Blocks
SATA and NVMe drives do not always use identical labels, but the principle is the same. Reallocated blocks, retired blocks, or grown bad blocks refer to NAND blocks removed from normal use because the controller judged them unreliable.A small nonzero number is not always a disaster. SSDs are designed to manage NAND imperfections internally, and some vendor reporting conventions can make interpretation difficult. What matters most is the trend.
A counter that remains stable over months may simply reflect normal management or factory-tested behavior. A counter that rises repeatedly is a warning that the SSD is consuming reserve resources and may be deteriorating.
The practical rule is straightforward: watch for change, not merely the presence of a number.
Media and Data Integrity Errors
For NVMe drives, Media and Data Integrity Errors is one of the most important fields. It indicates data errors that the drive could not correct through normal internal recovery mechanisms.A nonzero count does not always mean the drive is actively failing at that moment. The event could be historical, and storage logs must be read in context. But a count that increases—particularly alongside freezes, blue screens, missing files, read errors, or Event Viewer storage messages—is a strong reason to protect data immediately.
When this counter rises, do not spend days attempting to diagnose the drive while important files exist only on that device. Back up or clone first. Troubleshoot afterward.
Uncorrectable Error Counts
On SATA SSDs, a utility may show fields such as Uncorrectable Error Count, Reported Uncorrectable Errors, or vendor-specific ECC-related attributes. These deserve the same caution as NVMe media integrity errors.A corrected error is not necessarily a crisis; error correction is a normal part of flash management. An uncorrectable error means the correction process was unable to fully recover the requested data. Repeated uncorrectable events are not normal wear telemetry to ignore.
Unsafe Shutdowns
Unsafe Shutdowns count events where the SSD lost power without a clean shutdown sequence. This can happen during a power outage, forced reset, battery failure, system crash, unstable power supply event, or holding the power button.The counter alone does not prove data loss or SSD damage. It does, however, tell an important story. A rapidly increasing number can point to system stability problems, accidental power interruptions, or poor power behavior from a USB enclosure.
For desktop PCs, a quality power supply and a UPS can reduce avoidable risk. For laptops, persistent crashes and unexpected battery depletion should be investigated rather than dismissed as routine Windows annoyances.
Error Information Log Entries
The Error Information Log Entries field can be confusing. A nonzero count is not necessarily proof of NAND failure because it can include command, transport, controller, or host-side events. Unlike media error counters, it is not always a direct measure of damaged flash.Still, a rising count is useful when correlated with symptoms. If Windows begins logging disk resets, controller timeouts, or NVMe event warnings while this figure climbs, the SSD, its firmware, motherboard slot, cooling, or driver environment deserves attention.
SSD Symptoms That SMART Alone Will Not Explain
SMART is valuable, but it is not a crystal ball. A drive can fail without presenting a neat sequence of warning counters, while a healthy drive can have odd-looking vendor fields that never cause a practical issue.Windows users should combine SMART information with actual behavior. Warning signs include:
- Repeated application crashes when accessing files on one drive
- Files that become unreadable or unexpectedly corrupted
- Blue screens connected to storage or file-system activity
- System freezes during installs, updates, or game launches
- The SSD disappearing from BIOS or UEFI
- Random drive-letter disappearance in Windows
- Event Viewer reports involving disk, NTFS, StorNVMe, or controller resets
- Sudden read-only behavior
- Dramatically inconsistent file-copy performance
- A drive that appears intermittently only after a cold boot
That is another reason not to treat a single SMART field as conclusive evidence. Storage diagnosis is strongest when SMART trends, Windows logs, performance behavior, and hardware checks point in the same direction.
A Practical SSD Health Check Routine for Windows
Most users do not need to inspect SMART attributes every week. Constantly checking a perfectly healthy drive can create anxiety without improving reliability. A modest routine is enough.Establish a Baseline
After installing a new SSD or setting up a new PC:- Record the SSD model, firmware version, capacity, and endurance rating.
- Check the SMART report with CrystalDiskInfo, the manufacturer’s SSD tool, or smartctl.
- Note total writes, power-on hours, temperature, available spare, and error counts.
- Keep a screenshot or text export in a location that is not solely stored on that same drive.
- Confirm that a real backup system is working.
Recheck Every Few Months
For a typical home PC, checking SSD health every three to six months is generally sensible. Check sooner if the computer begins crashing, running unusually slowly, or showing file-system errors.Focus on whether key fields changed:
- Has total host write growth been reasonable for the workload?
- Did the wear estimate jump unexpectedly?
- Did temperatures remain normal?
- Did spare capacity decrease?
- Did retired-block or media-error counts increase?
- Did Windows begin reporting storage-related errors?
Update Firmware Carefully
SSD firmware can address compatibility bugs, stability problems, power-management issues, and performance defects. It can also occasionally introduce complications, which is why firmware updates should be handled deliberately.Before applying any SSD firmware update:
- Create a verified backup
- Use the SSD vendor’s official utility or documented method
- Ensure stable power
- Avoid interrupting the update
- Read whether the update requires a reboot or special preparation
- Confirm the update applies to the exact drive model
Why Backups Matter More Than Any Health Monitor
The most important conclusion is also the least glamorous: SMART monitoring cannot protect data by itself. It can provide warning, context, and evidence. It cannot restore an inaccessible BitLocker volume, recover a failed controller, or recreate the only copy of a project file.SSDs may fail gradually, but they can also fail abruptly. A controller or firmware problem may make a previously fast drive vanish before wear metrics suggest an obvious end-of-life scenario.
A sound Windows backup strategy should include more than one layer:
- A local backup to another physical drive
- Versioned file backup or cloud synchronization for important documents
- A system image or recovery plan for the Windows installation
- Offline or separate storage for irreplaceable data
- Periodic testing to confirm files can actually be restored
The Real Strength—and Limitation—of SSD SMART Data
The key strength of SSD SMART data is that it replaces guesswork with evidence. It can show whether a drive has written 10TB or 900TB, whether it has been powered for months or years, whether it has experienced unsafe shutdowns, and whether internal error conditions are stable or worsening.It also helps prevent unnecessary replacement. A five-year-old NVMe SSD with moderate writes, normal temperatures, no media errors, sufficient spare capacity, and stable SMART counters may still be a perfectly sensible system drive. Age alone does not condemn solid-state storage.
The limitation is that SMART is not a universal failure-prediction engine. Vendor-specific attributes vary, not every connection method exposes complete data, and not every failure announces itself through a rising counter. A green status indicator is useful reassurance, but it is not a guarantee.
The best Windows SSD health practice is therefore balanced rather than obsessive: inspect the data occasionally, understand the counters that reflect genuine risk, react quickly to trends and symptoms, keep firmware sensible, and maintain backups that make drive failure inconvenient rather than catastrophic.
When an SSD is quietly telling the system something is wrong, the objective is not to become a full-time PC mechanic. It is to notice the difference between normal lifetime use and evidence of deterioration early enough to preserve the data that matters.
References
- Primary source: XDA
Published: 2026-07-23T23:00:10+00:00
Loading…
www.xda-developers.com