
Bedroom Producers Blog first highlighted the release on August 26, while Jeesonic’s own product page confirms the core specifications: Metering Cockpit measures Momentary, Short-Term and gated Integrated loudness to ITU-R BS.1770-4, reports Loudness Range using EBU Tech 3342, and calculates true peak with 4x oversampling. KVR Audio lists version 1.0 for Windows 10/11 64-bit VST3 hosts and macOS 11 or later, with AU support reserved for the Mac edition.
The important part is not that another loudness meter is free. Several capable free meters already exist. Metering Cockpit’s differentiator is that Jeesonic is combining tools normally spread across separate plug-ins—loudness monitoring, crest-factor analysis, spectrum inspection, waveform display, correlation metering and reference playback—without requiring an account, subscription or stated time limit.
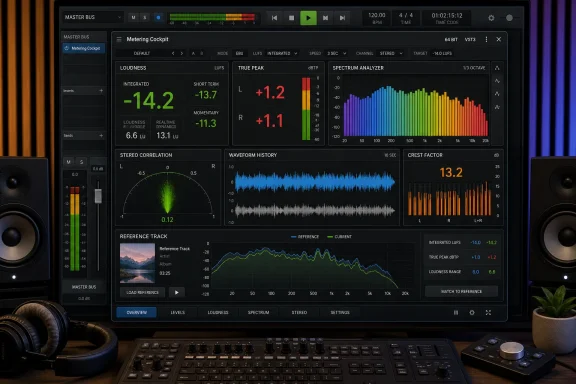 A meter designed for the master bus
Metering Cockpit is best suited to a DAW’s master or mix bus, where a producer, podcaster, video editor or mastering engineer wants to assess the whole signal rather than repair one channel. It displays Integrated LUFS, three-second Short-Term loudness, maximum true peak and Loudness Range in one “Loudness Card,” while a history view plots recent measurement data over a selectable window from 15 seconds to five minutes.
That history view has a draggable target line, which makes it useful for checking a mix against a delivery target without treating the target as an automatic correction. The plug-in measures; it does not normalize, limit or otherwise fix a track that misses the line. That distinction matters for Windows users who may assume a loudness meter is also a finalizing processor: Metering Cockpit is an analysis and monitoring tool, not a mastering suite.
The BS.1770-4 implementation is significant because peak meters alone cannot tell a creator how loud a full program will be perceived. A mix can avoid clipping while still landing far louder or quieter than comparable material once a distribution service, broadcaster or video platform applies its own normalization. Integrated loudness provides a session-wide reading, while Short-Term and Momentary values show more immediate shifts in level.
Jeesonic says the plug-in’s true-peak display uses four-times oversampling and retains the session’s highest peak. That is more useful than a plain sample-peak meter when checking a final signal for possible inter-sample peaks—peaks that can occur between digital samples during conversion or later encoding. It is still not a guarantee that every downstream codec or platform will behave identically, but it gives Windows-based DAW users a more relevant warning signal than a simple “below 0 dBFS” check.
The Windows format gap is the first thing to check
The release supports Windows 10 or later, but the Windows build is VST3 only. That immediately narrows the audience to users whose hosts load 64-bit VST3 effects. Current editions of Reaper, Ableton Live, Cubase, Studio One and many other modern DAWs fit that description, but the plug-in will not help someone looking for a standalone desktop loudness application, a browser tool, an old VST2 effect or a Pro Tools AAX plug-in.
Jeesonic’s current support material for its other Windows plug-ins describes a conventional VST3 installation: extract the download and place the .vst3 folder in the system VST3 directory, commonly C:\Program Files\Common Files\VST3\, then rescan plug-ins in the host. Metering Cockpit’s own product page confirms VST3 for Windows, but its public-facing material is less explicit about installation particulars than about its feature set. Users should therefore inspect the downloaded package and follow its included instructions rather than copying an older plug-in’s folder layout blindly.
There is also no stated support for Windows on Arm, 32-bit DAWs, Linux hosts running through compatibility layers, or multichannel surround workflows. The public product specification emphasizes stereo waveform and stereo correlation, and neither Jeesonic nor the independent launch coverage examined here identifies surround-channel metering. That does not mean the plug-in cannot load in an unusual setup; it means the release documentation does not establish that it will.
The macOS release is broader in plug-in format terms, with VST3 and Audio Unit options for Apple silicon and Intel Macs. Windows users should not read that cross-platform label as format parity. On Windows, VST3 is the entire delivery story.
Spectrum and listening tools go beyond a compliance meter
The feature set moves beyond loudness compliance in a useful way. Metering Cockpit includes a fractional-octave analyzer that can range from broad one-octave bands down to 1/24-octave resolution, alongside a linear FFT view. Broad bands are appropriate for spotting a mix that is generally bass-heavy, mid-forward or overly bright; finer resolution is better suited to locating a narrow resonance or competing frequencies.
The developer says the analyzer uses an 8,192-point window at coarser resolutions and 16,384 points at 1/6 octave and finer. Those details are meaningful because analyzer resolution always trades responsiveness and broad tonal context against precision. A user hunting a ringing note around 200 Hz needs a different view from someone deciding whether a full mix is tilted too dark.
Jeesonic also includes a crest-factor display beside its level meters. Crest factor is a rough representation of the distance between peaks and average signal level—one useful indicator of transient headroom and density. It should not be treated as a score for musical quality, but it can flag a track whose peaks and average level have been pushed unusually close together by compression or limiting.
The plug-in visualizes that range as a color-coded bar, with green representing greater headroom and red denser material. This is a convenience feature rather than a new measurement standard, but it could make Metering Cockpit easier to scan during a busy mix session than a stack of numerical readouts.
The stereo section adds a waveform display and a correlation meter running from -1 to +1. Correlation is particularly useful when checking whether wide stereo processing may collapse poorly to mono. It is not a substitute for listening in mono, and a correlation reading can change radically between passages, but keeping it visible beside loudness and spectrum data makes it easier to catch a problem before export.