
Nature Methods has published a two-page Points of View article arguing that biological figures should be treated as reusable code rather than disposable images — and its strongest practical recommendation is simple: researchers using Python, R, JavaScript, or AI-assisted tools should preserve the plotting workflow alongside the final graphic. For Windows users doing science in Jupyter, VS Code, RStudio, or a managed research environment, that means a paper-ready PNG is no longer sufficient evidence of how a chart was made.
The August 6 article, “Code to plot,” by visualization researcher Alexander Lex and biologist Helena Klara Jambor, is not a new charting package, standard, or AI product announcement. Nature Methods classifies it as commentary. But the figures make the operational case clearer than the short teaser does: the same penguin dataset can produce substantially different scatter plots in Matplotlib, Seaborn, and Vega-Lite, while a chat-based plotting workflow should culminate in adaptable vector output such as SVG rather than a flattened PNG.
That is useful advice, but it also exposes the unresolved part of the vibe coding pitch. A natural-language interface can speed up the first draft of a figure; it does not record the analytical decisions that make the result defensible. A chart generated after several prompts, manual edits, and undocumented notebook state can be harder to reproduce than one written from scratch.
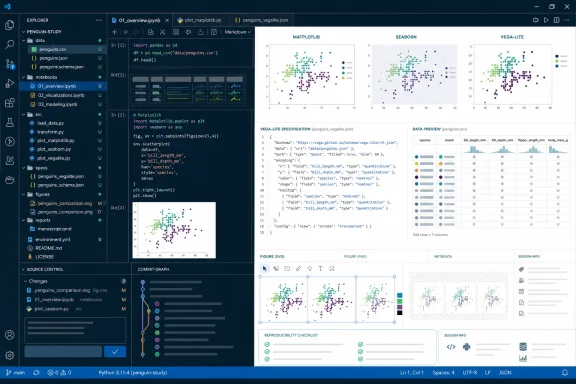
The article’s central premise is that biologists can “reuse, remix and vibe code” for scientific figures. Its first illustration shows three plotting approaches applied to one dataset: Matplotlib’s procedural style, Seaborn’s higher-level statistical visualization interface, and Vega-Lite’s declarative grammar. The point is not that one library is inherently correct. It is that the underlying visualization has a machine-readable description that can be inspected, changed, and rerun.
That distinction changes the status of a published chart. A PNG embedded in a PDF is a visual result, but it does not reveal the data filtering, category ordering, color mapping, point jitter, axis transformations, missing-value policy, or library versions behind it. Even an SVG, though editable and far better for journal production, can preserve only the graphical output rather than the transformation logic that generated it.
Nature Methods’ own illustration tells readers to request editable SVG output from a chat interface rather than PNG. That is sound production guidance: SVG preserves vectors and text as separate objects, which makes later corrections less destructive. But SVG is not a reproducibility package. It cannot, by itself, tell another researcher whether the plot was built from the full dataset, an intermediate CSV, an altered spreadsheet, or a filtered subset created during exploration.
The missing deliverable is a compact figure bundle: source data or an unambiguous route to it, a script or notebook, a declared environment, and the rendered figure. For organizations that manage research workstations, this is less glamorous than generative AI but far more consequential. It turns a figure from a static asset into an auditable build artifact.
This is exactly where AI assistance has value. Researchers often spend avoidable time remembering plotting-library syntax, locating the right chart type, or translating a rough visual idea into code. Seaborn itself is designed as a high-level interface that works with Matplotlib’s deeper customization, while Vega-Lite uses a structured JSON specification built around marks and data encodings. Both models can make it easier to translate intent into a plot, whether that intent arrives through code or a prompt.
The danger is accepting the first plausible chart as the final analytical result. A language model may create valid Python or R that looks polished while making choices the user did not explicitly request: default confidence intervals, implicit aggregation, alphabetical rather than scientific category order, an inappropriate palette for color-vision accessibility, or a scale that visually exaggerates a small effect. If the code runs without error, the risk is not primarily a broken script. It is a credible-looking wrong figure.
The article’s call for iterative human review is therefore more important than its use of the phrase “vibe code.” Researchers need to review the figure at three separate levels:
Matplotlib remains useful when a figure needs fine-grained control. A script can explicitly construct a figure, axes, markers, labels, legends, layouts, and export settings. That specificity is valuable in regulated or publication-heavy work, but it also means a small visual revision can require touching several parts of the code.
Seaborn makes common statistical plots quicker to express and can produce strong defaults for exploratory analysis. Its convenience, however, can hide some decisions in library defaults. A team that starts with Seaborn should still make grouping, ordering, error bars, data treatment, and export parameters explicit before a figure crosses from analysis into a report or manuscript.
Vega-Lite offers a different preservation model. Its declarative specifications describe the mark and the mapping between data fields and visual properties such as position, color, and size. A JSON specification can be compact, checked into version control, validated by editor tooling, and rendered across web-oriented workflows. For teams already publishing interactive dashboards or sharing data applications, that form may travel better than a notebook full of accumulated state.
None of those approaches removes the need for a durable environment. A Matplotlib script that depended on one version of pandas, a particular font, and a local data path may behave differently on another Windows machine. A Vega-Lite specification can be portable, but it still needs the referenced dataset, renderer, and versioned schema. Reuse is a chain, and the plotting file is only one link.
That does not invalidate Lex and Jambor’s argument, but it narrows who can read its detailed recommendations. More importantly, the page does not link to a companion repository, downloadable example notebook, or licensed source bundle for the figures it uses to champion remixable plotting. The visible page names Matplotlib, Seaborn, Vega-Lite, the Grammar of Graphics, and FAIR principles for research data, but readers cannot directly obtain a runnable implementation from the article record.
No other outlet had independently reported the article’s release as of August 6. The evidence available publicly is therefore the Nature Methods record and the article’s visible figures, not a broader reporting trail or a newly announced software initiative. Readers should treat it as a concise editorial intervention in an ongoing reproducibility problem, rather than as a new standard with enforcement behind it.
The FAIR principles for research software provide the larger context. Software intended for research should be findable, accessible, interoperable, and reusable; documentation, versioning, provenance, and clear licensing all support that goal. A screenshot of code, a lone notebook attached to a paper, or a generated image placed in a slide deck does not meet that threshold.
A minimal figure handoff should include the script, notebook, or Vega-Lite specification; the exact input data or a documented retrieval step; package versions; the intended output files; and a short README identifying the command or notebook cell sequence that regenerates the figure. If data cannot be shared because of privacy, licensing, or patient protections, the documentation should say so and identify the approved access path.
The authors’ SVG recommendation belongs in that workflow because an editable vector export gives production teams a safer way to resize or correct typography. But the master record should remain the source code and data transformation path, not the edited SVG file. Once someone changes an SVG manually, it has become a derivative artifact and should be labeled as such.
The immediate consequence of “Code to plot” is not that scientists need another plotting library. It is that every figure produced through a notebook, script, or chat assistant should be treated like a small software release: versioned, reviewable, runnable, and accompanied by enough context that the next person can tell where every mark on the page came from.
That is useful advice, but it also exposes the unresolved part of the vibe coding pitch. A natural-language interface can speed up the first draft of a figure; it does not record the analytical decisions that make the result defensible. A chart generated after several prompts, manual edits, and undocumented notebook state can be harder to reproduce than one written from scratch.
 The Figure File Is Usually the Dead End
The article’s central premise is that biologists can “reuse, remix and vibe code” for scientific figures. Its first illustration shows three plotting approaches applied to one dataset: Matplotlib’s procedural style, Seaborn’s higher-level statistical visualization interface, and Vega-Lite’s declarative grammar. The point is not that one library is inherently correct. It is that the underlying visualization has a machine-readable description that can be inspected, changed, and rerun.That distinction changes the status of a published chart. A PNG embedded in a PDF is a visual result, but it does not reveal the data filtering, category ordering, color mapping, point jitter, axis transformations, missing-value policy, or library versions behind it. Even an SVG, though editable and far better for journal production, can preserve only the graphical output rather than the transformation logic that generated it.
Nature Methods’ own illustration tells readers to request editable SVG output from a chat interface rather than PNG. That is sound production guidance: SVG preserves vectors and text as separate objects, which makes later corrections less destructive. But SVG is not a reproducibility package. It cannot, by itself, tell another researcher whether the plot was built from the full dataset, an intermediate CSV, an altered spreadsheet, or a filtered subset created during exploration.
The missing deliverable is a compact figure bundle: source data or an unambiguous route to it, a script or notebook, a declared environment, and the rendered figure. For organizations that manage research workstations, this is less glamorous than generative AI but far more consequential. It turns a figure from a static asset into an auditable build artifact.
AI Can Produce a Plot Before It Produces a Method
The second figure in Lex and Jambor’s article lays out a three-step chat workflow: tell an AI system to make a plot, review and refine its output, then request adaptable SVG rather than PNG. It also calls out a mundane but important correction — changing machine-oriented labels such as a field name into readable publication labels.This is exactly where AI assistance has value. Researchers often spend avoidable time remembering plotting-library syntax, locating the right chart type, or translating a rough visual idea into code. Seaborn itself is designed as a high-level interface that works with Matplotlib’s deeper customization, while Vega-Lite uses a structured JSON specification built around marks and data encodings. Both models can make it easier to translate intent into a plot, whether that intent arrives through code or a prompt.
The danger is accepting the first plausible chart as the final analytical result. A language model may create valid Python or R that looks polished while making choices the user did not explicitly request: default confidence intervals, implicit aggregation, alphabetical rather than scientific category order, an inappropriate palette for color-vision accessibility, or a scale that visually exaggerates a small effect. If the code runs without error, the risk is not primarily a broken script. It is a credible-looking wrong figure.
The article’s call for iterative human review is therefore more important than its use of the phrase “vibe code.” Researchers need to review the figure at three separate levels:
- They need to verify that the plotted rows, columns, transformations, and units match the intended analysis.
- They need to inspect whether the chart type, scale, annotations, and color choices accurately communicate the evidence.
- They need to rerun the workflow in a clean environment before treating the output as publication-ready.
Three Libraries, Three Different Kinds of Reuse
The Matplotlib, Seaborn, and Vega-Lite comparison in Nature Methods points toward a practical choice that matters more than tool preference: whether a team’s figures are best preserved as imperative code, higher-level library calls, or declarative specifications.Matplotlib remains useful when a figure needs fine-grained control. A script can explicitly construct a figure, axes, markers, labels, legends, layouts, and export settings. That specificity is valuable in regulated or publication-heavy work, but it also means a small visual revision can require touching several parts of the code.
Seaborn makes common statistical plots quicker to express and can produce strong defaults for exploratory analysis. Its convenience, however, can hide some decisions in library defaults. A team that starts with Seaborn should still make grouping, ordering, error bars, data treatment, and export parameters explicit before a figure crosses from analysis into a report or manuscript.
Vega-Lite offers a different preservation model. Its declarative specifications describe the mark and the mapping between data fields and visual properties such as position, color, and size. A JSON specification can be compact, checked into version control, validated by editor tooling, and rendered across web-oriented workflows. For teams already publishing interactive dashboards or sharing data applications, that form may travel better than a notebook full of accumulated state.
None of those approaches removes the need for a durable environment. A Matplotlib script that depended on one version of pandas, a particular font, and a local data path may behave differently on another Windows machine. A Vega-Lite specification can be portable, but it still needs the referenced dataset, renderer, and versioned schema. Reuse is a chain, and the plotting file is only one link.
The Article’s Accessibility Problem Mirrors Its Argument
There is an awkward disconnect in the publication itself. Nature Methods presents “Code to plot” as an argument for reuse, data publication and archiving, yet the article is a subscription item. Nature’s page lists institutional access, a monthly subscription option, and a $39.95 individual-article purchase; it does not expose the full prose as open content. The landing page does provide the author names, the two figure images, the article metadata, and the reference list.That does not invalidate Lex and Jambor’s argument, but it narrows who can read its detailed recommendations. More importantly, the page does not link to a companion repository, downloadable example notebook, or licensed source bundle for the figures it uses to champion remixable plotting. The visible page names Matplotlib, Seaborn, Vega-Lite, the Grammar of Graphics, and FAIR principles for research data, but readers cannot directly obtain a runnable implementation from the article record.
No other outlet had independently reported the article’s release as of August 6. The evidence available publicly is therefore the Nature Methods record and the article’s visible figures, not a broader reporting trail or a newly announced software initiative. Readers should treat it as a concise editorial intervention in an ongoing reproducibility problem, rather than as a new standard with enforcement behind it.
The FAIR principles for research software provide the larger context. Software intended for research should be findable, accessible, interoperable, and reusable; documentation, versioning, provenance, and clear licensing all support that goal. A screenshot of code, a lone notebook attached to a paper, or a generated image placed in a slide deck does not meet that threshold.
What Windows-Based Research Teams Should Preserve
For researchers and administrators supporting Windows-based analysis stacks, the practical response is not to prohibit AI plotting tools. It is to make the exported chart the final product of a repeatable workflow rather than the only surviving artifact.A minimal figure handoff should include the script, notebook, or Vega-Lite specification; the exact input data or a documented retrieval step; package versions; the intended output files; and a short README identifying the command or notebook cell sequence that regenerates the figure. If data cannot be shared because of privacy, licensing, or patient protections, the documentation should say so and identify the approved access path.
The authors’ SVG recommendation belongs in that workflow because an editable vector export gives production teams a safer way to resize or correct typography. But the master record should remain the source code and data transformation path, not the edited SVG file. Once someone changes an SVG manually, it has become a derivative artifact and should be labeled as such.
The immediate consequence of “Code to plot” is not that scientists need another plotting library. It is that every figure produced through a notebook, script, or chat assistant should be treated like a small software release: versioned, reviewable, runnable, and accompanied by enough context that the next person can tell where every mark on the page came from.
References
- Primary source: Nature
Published: 2026-08-06T00:00:00+00:00
Loading…
www.nature.com