
The hierarchy is a substantial refresh of Tom’s Hardware’s long-running database, covering current DDR5-era Intel and AMD desktop platforms. It combines 17 games into a geometric-mean gaming score, while the application rankings draw from rendering, encoding, browser, and other tests. That breadth is valuable, but it does not produce one universal “fastest CPU” verdict. It produces three answers for three different bottlenecks.
Independent testing supports the broad outline. AMD formally launched the eight-core, 16-thread Ryzen 7 9850X3D in January at a $500 MSRP, and Gamers Nexus found it could be up to 4% faster than the Ryzen 7 9800X3D in gaming, while sometimes matching it. Intel’s Core Ultra 7 270K Plus, meanwhile, is a 24-core Arrow Lake Refresh chip whose unusually strong light-workload showing is tied in part to Intel’s new Binary Optimization Tool, or iBOT.
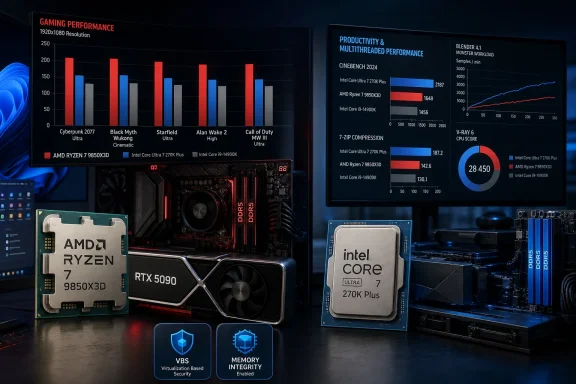 Ryzen 7 9850X3D Holds the Gaming Lead by a Small Margin
Tom’s Hardware assigns the Ryzen 7 9850X3D a 100% score, with the Ryzen 7 9800X3D at 97%, the 16-core Ryzen 9 9950X3D at 95.7%, and the Ryzen 9 9900X3D at 86.9%. The Intel Core i9-14900K follows at 78.2%, while the Core Ultra 7 270K Plus lands at 77.5%.
Those results reinforce a familiar lesson about AMD’s X3D lineup: extra stacked L3 cache continues to pay off in games that are sensitive to memory latency and cache capacity. The standings are particularly relevant for players targeting very high refresh rates in titles such as Counter-Strike 2, Microsoft Flight Simulator 2024, Baldur’s Gate 3, and Cyberpunk 2077, all of which appear in Tom’s Hardware’s current suite.
But a 100-to-97 result should not be read as a mandate for 9800X3D owners to replace working hardware. Gamers Nexus measured the newer chip at no more than 4% ahead of its predecessor and sometimes indistinguishable. TechSpot likewise characterized the 9850X3D as delivering more speed with lower efficiency. The new part is the fastest gaming CPU in this test pool, yet the evidence does not support treating it as a transformational upgrade from AMD’s prior Zen 5 X3D flagship.
The price relationship changes the recommendation more than the leaderboard does. Tom’s Hardware listed the 9850X3D at $484 and the 9800X3D at $415 when its table was updated, a gap large enough to exceed the performance delta. Street prices move quickly, especially around major launches and promotions, so buyers should treat the chart’s dollar figures as a snapshot rather than a fixed ranking. If those prices remain separated by roughly $70, the older 9800X3D remains the more rational new-build gaming choice for most people.
The RTX 5090 and 1080p Test Are a Ceiling, Not a Typical PC
Tom’s Hardware used an Nvidia GeForce RTX 5090 Founders Edition at 1080p with High and Ultra settings to expose CPU differences. It also ran each game several times and used the median result, then calculated a geometric mean across the entire game suite. Those decisions make sense for comparing processors: a slower GPU or a higher resolution would hide many of the differences by moving the bottleneck to graphics performance.
They also define what the ranking cannot tell a buyer. A system with an RTX 5070, RTX 5060 Ti, Radeon RX 9070-class card, or an older GPU will often be GPU-limited before it realizes the gaps visible between top processors in an RTX 5090 test. The same applies at 1440p and especially 4K, where visual settings and GPU choice usually carry more weight than a few percentage points of CPU performance.
This does not invalidate the hierarchy. It means the right use is comparative: it shows the upper bound of CPU separation in a controlled Windows gaming environment, rather than a promise of a proportional frame-rate gain in every rig. Someone selecting a processor for a competitive 1080p system paired with a flagship graphics card should care about the top of this chart. Someone building a 4K machine around a midrange GPU should put more of the budget into the graphics card, storage, memory capacity, or display.
Tom’s Hardware also excludes automatic overclocking profiles, including AMD Precision Boost Overdrive and Intel’s Extreme power profile. That is a defensible baseline because both can change power, cooling, and warranty assumptions. Users comparing their own results to the table should make sure they have not silently enabled a motherboard vendor’s “enhanced” preset, which can turn a nominally stock comparison into a power-limit comparison.
Windows Security Settings Are Part of the Test Configuration
The most consequential small print for Windows users is that Tom’s Hardware tested with Virtualization-Based Security disabled. VBS is the Windows security architecture behind protections including Memory Integrity, also known as Hypervisor-Protected Code Integrity. Microsoft documents Memory Integrity as a VBS feature that isolates kernel-mode code-integrity checks to make kernel-level malware attacks harder.
That means the scores are not a direct representation of every Windows 11 installation. A home PC may have Memory Integrity enabled through Windows Security, and an organization may enforce it with Group Policy or Intune. A system also may use Hyper-V, Windows Sandbox, Credential Guard, or other virtualization-based protections that affect its configuration and performance characteristics.
Readers should not turn off VBS simply to chase a chart position. The hierarchy is clear about the configuration it uses, and removing a security control changes the threat model as well as the benchmark result. For a personal performance check, the useful step is to record whether VBS is running before comparing scores. In msinfo32, Windows reports the state of Virtualization-based Security; Memory Integrity is also visible under Windows Security’s Device security and Core isolation settings.
For IT administrators, the operational takeaway is simpler: benchmark like against like. A Windows 11 fleet with Memory Integrity enforced should be tested with that policy active. A test image with VBS disabled may help isolate CPU capability, but it cannot stand in for a managed endpoint baseline.
Intel’s Application Win Has Important Conditions
The Core Ultra 7 270K Plus leads Tom’s Hardware’s single-threaded application table, scoring 100% against the Core Ultra 9 285K’s 98.5% and Ryzen 9 9950X’s 93.3%. It also posts 91.9% in the site’s heavily threaded ranking, behind only AMD’s Ryzen 9 9950X3D2, Ryzen 9 9950X3D, and Ryzen 9 9950X. That is a strong showing for a processor positioned far below AMD’s most expensive 16-core models.
The result fits Intel’s official positioning of the 270K Plus as a 24-core, 24-thread chip with eight Performance-cores and 16 Efficient-cores. Unlike the older Core i9-14900K, it does not use Hyper-Threading. Its multithreaded performance therefore depends heavily on its larger E-core count, scheduling, memory behavior, and Intel’s refresh changes rather than a thread-count advantage.
The gaming caveat is iBOT. Intel’s Binary Optimization Tool is designed to apply game-specific binary optimizations, and Intel’s own performance material limits its claims to enabled, supported titles. PC Gamer’s testing and analysis similarly found that the feature can work as advertised but has a limited reach because support is not universal. Tom’s Hardware associates the 270K Plus’ gaming position with iBOT, so its 77.5% gaming score should be interpreted as a result for that reviewed software setup, not as a blanket performance guarantee across an entire Steam library.
For creators, developers, and users whose work is dominated by CPU rendering, encoding, compilation, or other parallel tasks, the hierarchy points in a different direction. AMD’s Ryzen 9 9950X3D2 takes the multithreaded lead at 100%, followed by the 9950X3D at 96.2% and the 9950X at 93%. The 270K Plus is close enough to deserve consideration, but it does not displace AMD’s 16-core Zen 5 parts for the highest sustained-throughput workloads.
The Refresh Is Useful, but Its Coverage Is Still Incomplete
Tom’s Hardware says this is the first half of its largest hierarchy overhaul and currently concentrates on DDR5 platforms, with older processors to be expanded separately. That scope matters for owners of AM4, DDR4-era Intel systems, and older workstation hardware. The new results are more consistent for current platforms, but they are not yet a complete longitudinal record across every CPU generation a forum member may be deciding whether to replace.
The best practical use of the revised hierarchy is to narrow a shortlist, then test the workload that actually determines satisfaction. A gamer should use repeatable in-game scenes and capture frame times with tools such as CapFrameX or Nvidia FrameView. A video editor should benchmark the codec and export settings used in production, perhaps with HandBrake or a relevant PugetBench workload. A Windows power user troubleshooting an apparent regression should keep BIOS settings, background software, Windows security settings, memory configuration, and GPU driver constant.
The 2026 table settles one narrow contest: the Ryzen 7 9850X3D is currently the fastest gaming chip in Tom’s Hardware’s RTX 5090, 1080p test, while the Core Ultra 7 270K Plus leads its light application metrics and remains unusually competitive in heavier work. The purchase decision is less dramatic. Match the processor to the GPU, resolution, Windows security baseline, and applications already on the machine—and do not pay flagship money to exchange a 97% result for a 100% result unless those final frames are the work.
