sew333

Senior Member
Joined
Jan 7, 2017
Messages
102
Hello.
I have a question. I am using Rtx 2080 Ti Waterforce and 9900K and Corsair 850RmX. ALL stock,no oc.
I run 3dmark firestrike 1920x1080. Monitor 1440P native.
Using Msi Afterburner not the newest,and riva tuner statistic.

Few days ago ,when i run Fire Strike GPU test 1 on loop, i saw a clock dip from 1980mhz to 1570mhz for 1ms. GPU LOAD not changed,it was 96%. Only gpu clock dip for a 1ms.
I checked in logs,and during that gpu power drop to 58%.


Log from MSI:
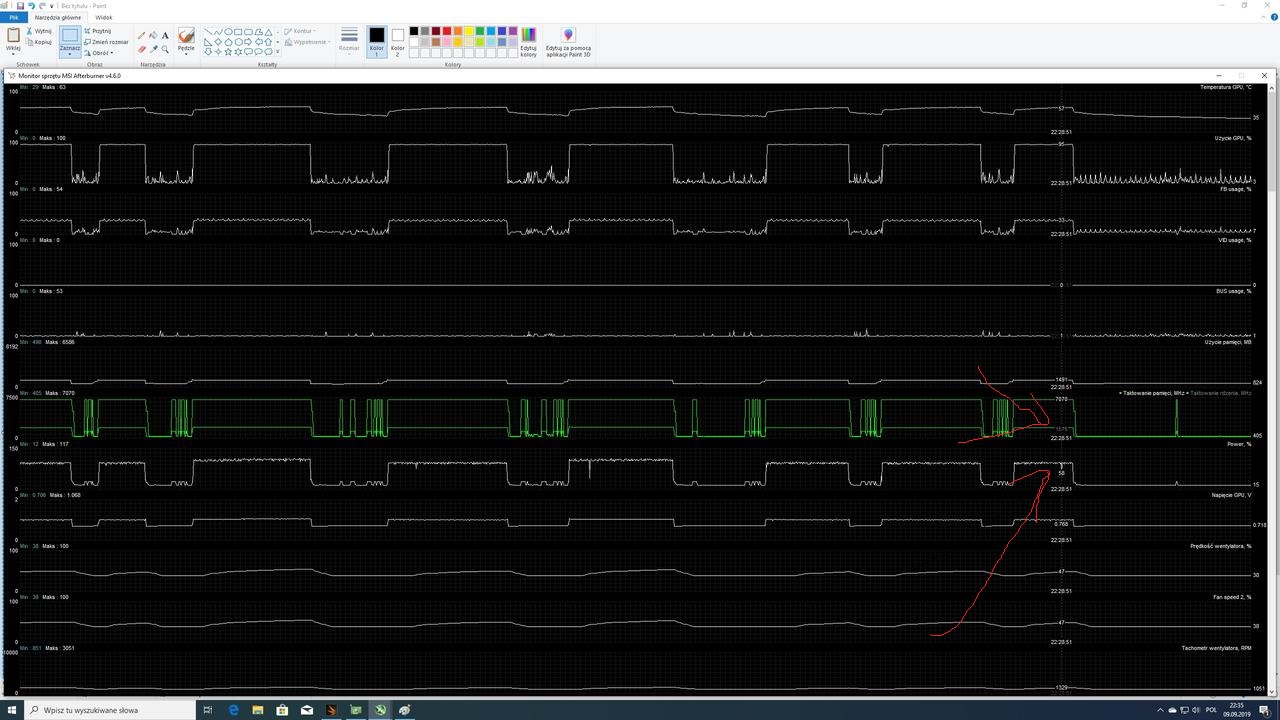
ui1.jpg


But then i look at gpuz and gpuz not report that,all was fine,no drop in clock and power.


I tried to replicate that. So i run in windowed mode Fire Strike and was messing in Windows, to force gpu power drops. It drops gpu power but clock was steady and not dropped,like before.

So why i cant reproduce that clock drop anymore? And why that happened? Should i worry?


Solution
It seems like there was a temporary clock dip observed during the GPU test in 3DMark Fire Strike, along with a corresponding power drop, which prompted some concern. Here are some insights and steps you can consider: 1. Monitoring Software: It's not uncommon for monitoring software to display brief anomalies. Sometimes these are false readings due to software discrepancies and may not reflect the actual behavior of the hardware. 2. Overclocking & Drivers: Check if any recent changes were made to the system, such as driver updates or modifications in the GPU settings that might have caused this behavior. 3. Thermal Monitoring: Ensure that the GPU temperatures are within acceptable limits during stress loads. High...
It seems like there was a temporary clock dip observed during the GPU test in 3DMark Fire Strike, along with a corresponding power drop, which prompted some concern. Here are some insights and steps you can consider: 1. Monitoring Software: It's not uncommon for monitoring software to display brief anomalies. Sometimes these are false readings due to software discrepancies and may not reflect the actual behavior of the hardware. 2. Overclocking & Drivers: Check if any recent changes were made to the system, such as driver updates or modifications in the GPU settings that might have caused this behavior. 3. Thermal Monitoring: Ensure that the GPU temperatures are within acceptable limits during stress loads. High temperatures can trigger thermal throttling, affecting clock speeds momentarily. 4. Power Supply: The power supply unit (PSU) should provide stable power to the components. If there are fluctuations or issues with power delivery, this could potentially impact GPU performance. 5. Hardware Inspection: Consider checking the physical components for any signs of damage or issues. Clean out any dust that might be affecting cooling. 6. Recurring Anomaly: If you can't replicate the issue consistently, it's possible that the initial event was an isolated incident. It might not be a cause for concern if the behavior doesn't recur. 7. Further Testing: If the system seems stable otherwise and the anomaly doesn't repeat itself, it might not be a major issue. However, engaging in further stress testing or monitoring during gaming sessions can help determine if there are underlying concerns. 8. Professional Diagnosis: For peace of mind or if you encounter further anomalies, seeking professional help or contacting the manufacturer's support for advice can be beneficial. Given that you couldn't reproduce the clock drop and the GPU behavior seems normal now, it's a good sign. Keep an eye on system performance during various tasks or games and monitor the GPU closely for any recurring issues.


Solution
Back
Top