

Six free Windows tools—Windows Device Performance & Health, Windows Resource Monitor, Windows Memory Diagnostic, HWiNFO, Wintoys, and CrystalDiskInfo—can isolate storage pressure, runaway processes, faulty RAM, overheating, damaged system files, and failing drives before a slow PC is misdiagnosed as simply old. The important word is isolate: none of these utilities is a magic “speed up” button, and several do not repair anything at all. Their value is that they replace an expensive guess with evidence. Used in the right order, they form a practical diagnostic ladder from a basic Windows health report to the early warning signs of physical drive failure.
“Slow” is one of the least useful descriptions in computer troubleshooting. It can mean applications take too long to open, games stutter after several minutes, file copies freeze, the desktop stops responding, or the entire machine feels delayed even though Task Manager appears calm.
Those symptoms do not necessarily share a cause. A nearly full system drive, a program rebuilding a database, defective memory, thermal throttling, corrupted Windows files, and a deteriorating hard disk can all produce some version of the same complaint. Buying more RAM will not rescue a failing drive, cleaning temporary files will not repair faulty memory, and reinstalling Windows will not fix inadequate cooling.
That is why the six-tool collection highlighted by MakeUseOf is more useful as a sequence than as a list. Windows Device Performance & Health provides broad triage. Windows Resource Monitor identifies active contention. Windows Memory Diagnostic tests RAM. HWiNFO exposes temperatures and other hardware sensor data. Wintoys makes Windows repair utilities easier to reach, while CrystalDiskInfo concentrates on storage-device health.
The result is not a replacement for professional hardware testing. It is a way to make the first round of troubleshooting rational, repeatable, and considerably less vulnerable to placebo fixes.
That scope explains both the feature’s usefulness and its limitation. It can tell a user that a broad category needs attention, but it is not designed to identify every process, file, component, or sensor responsible for a slowdown. A green checkmark means the dashboard has not identified a problem in the categories it covers; it does not certify that every part of the PC is healthy.
The MakeUseOf author begins by looking for yellow warning icons, then selecting “See more info” when the dashboard flags an issue. That is an appropriate workflow because the page excels at directing nontechnical users toward an actionable Windows setting rather than confronting them with raw counters.
Storage capacity is the obvious example. The author says Windows needs at least 20 percent of the storage drive free to run efficiently, but that figure should be understood as the author’s operating rule rather than a universal Microsoft requirement. The practical principle is still sound: Windows, applications, browsers, creative tools, updates, caches, and virtual memory all need working room, and performance can deteriorate when a system drive is severely constrained.
The same dashboard can surface abnormal battery use on a laptop and suggest corrective action. That does not make it a full battery-analysis suite, but it makes it an effective first stop when reduced runtime and sluggish behavior appear together.
The diagnostic mistake would be to stop here. Device Performance & Health answers, “Has Windows noticed a broad health concern?” It does not fully answer, “What is the machine doing at the moment it becomes slow?”
Windows Resource Monitor closes that gap. It can be launched by searching for “resmon” or by opening Task Manager, selecting the “Performance” tab, and clicking “Open Resource Monitor.” Microsoft’s troubleshooting guidance also directs users to Resource Monitor when they need to inspect resource consumption in more detail.
The “Overview” tab combines CPU, memory, disk, and network activity, which makes it especially useful when the source of a slowdown is not obvious. A frozen application may actually be waiting for storage. A background process that uses little CPU may still be generating enough disk traffic to make every foreground task feel unresponsive.
MakeUseOf’s Adobe Lightroom example demonstrates why this distinction matters. The author found Adobe Lightroom generating substantial writes in “Processes with Disk Activity” on the “Disk” tab even when the application did not appear to be in active use. Lightroom Classic was reportedly rebuilding previews and updating catalogs in the background.
Task Manager could have shown that the disk was busy. Resource Monitor exposed the application responsible and helped connect that activity to the files being accessed. The author then moved the catalog and preview files to a secondary drive and changed Lightroom’s default location for them.
That is real diagnosis: observation, attribution, intervention, and verification. It is categorically different from ending random tasks until the machine briefly feels faster.
Resource Monitor is also where users should resist the temptation to treat all background activity as malicious or unnecessary. Windows and legitimate applications perform indexing, synchronization, maintenance, updates, database work, and cache management without keeping a large window on screen. High activity becomes meaningful when it correlates with the slowdown and persists long enough to explain the symptom.
For administrators, that correlation is the key. Capture what the system is doing while the complaint is occurring. A screenshot taken after the disk queue has cleared or the CPU spike has ended can turn an observable problem back into a mystery.
Windows Memory Diagnostic provides a built-in test without requiring another download. Press Win + R, enter “mdsched.exe,” and select “Restart now and check for problems” when immediate testing is appropriate. Because the utility runs during a reboot, it can examine memory outside the normal Windows desktop environment.
For a more thorough pass, the MakeUseOf author recommends pressing F1 during the test and selecting “Extended” testing, with additional passes where needed. The trade-off is time: deeper testing takes longer, but intermittent memory faults are precisely the sort of defects a quick pass may not expose.
After Windows starts again, results can be found through Event Viewer. Press Win + X, open “Event Viewer,” expand “Windows Logs,” select “System,” press Ctrl + F, and search for “MemoryDiagnostics-Results.”
That final retrieval step matters because users often see a test complete, return to Windows, and assume that no visible warning means nothing was found. A diagnostic process is not complete until the result has been located and recorded.
Even then, a clean result should be interpreted carefully. One successful run reduces suspicion; it does not make every possible intermittent hardware problem impossible. If crashes or corruption continue, the correct response is to retain the result as one piece of evidence and broaden the investigation rather than repeatedly running the same test in hope of a different answer.
In a managed environment, record the user’s original symptom, the selected test mode, whether the test completed, and the Event Viewer result. Without that context, “memory test passed” can become a dead-end note rather than a useful troubleshooting data point.
That is where HWiNFO earns its place. The utility provides detailed hardware information and real-time sensor monitoring for temperatures, voltages, fan speeds, clocks, and other component data. HWiNFO’s official project documentation emphasizes both live monitoring and sensor logging, making it useful for problems that appear only under sustained workloads.
The MakeUseOf workflow uses the Installer option and a standard 64-bit installation. On launch, the “Summary” window presents the hardware configuration, while the “Sensors” window supplies the live readings. In the article’s description, green values are normal, yellow indicates caution, and red means immediate attention is needed.
The author reports seeing a CPU reach 90°C while gaming and replacing the computer’s fans before damage occurred. The larger lesson is not that one temperature automatically proves a particular cooling fault. It is that a performance complaint occurring during gaming can be correlated with a thermal condition that only appears under load.
A PC can feel fast when first turned on and slow later because heat accumulates. If the system reduces performance to control temperature, closing applications or clearing storage may produce no lasting improvement. The machine is not short of theoretical processing power; it is unable to sustain that power under its current thermal conditions.
Logging is particularly valuable here. A user watching the “Sensors” window after exiting a game may see temperatures falling and miss the peak that coincided with the slowdown. A recorded session can reveal whether the symptom appeared alongside rising temperature, changing fan behavior, or reduced operating clocks.
HWiNFO also introduces an important diagnostic discipline: sensor readings require context. A value must be considered alongside the workload, the component, the cooling design, and the behavior over time. The most useful evidence is usually not a single colorful number but a repeatable pattern: start the workload, observe the symptom, capture the sensors, stop the workload, and compare.
From there, the application exposes DISM, SFC, and CHKDSK through straightforward controls. As summarized by MakeUseOf, DISM repairs the core Windows system image, SFC scans and fixes individual system files, and CHKDSK checks hard drives for errors and bad sectors.
Convenience is Wintoys’ strength. Windows has long included capable maintenance utilities, but they are scattered across interfaces and often invoked from command-line environments that discourage inexperienced users. A consolidated dashboard lowers that barrier.
Convenience is not diagnosis, however. Wintoys does not eliminate the need to establish whether file corruption or disk errors plausibly explain the complaint. Running every repair utility whenever a PC feels slow can waste time, complicate support records, and encourage users to confuse activity with progress.
The correct place for Wintoys is after initial observation. If Windows features fail, system components behave inconsistently, or other evidence points toward damaged files, its one-click access can be useful. If Resource Monitor shows that Lightroom is saturating a drive with legitimate background writes, repairing the Windows image addresses a different problem.
The flame icon on the dashboard can run a quick system benchmark after checks or changes. That can help compare the machine’s apparent performance before and after an intervention, but a benchmark should not replace reproduction of the original symptom. A higher score is less persuasive than confirmation that the file copy, application launch, or workload that previously stalled now completes normally.
Wintoys is therefore best understood as an orchestration layer. It simplifies access to repair mechanisms that already exist, but it cannot supply the judgment required to choose the right mechanism.
CrystalDiskInfo specializes in drive health. The MakeUseOf article directs users to obtain it through SourceForge, extract the package, and run DiskInfo64.exe for the 64-bit version. The official Crystal Dew World project describes CrystalDiskInfo as an HDD and SSD utility with support for a range of storage interfaces, while also documenting that controller and enclosure compatibility can vary.
Its first layer of interpretation is deliberately simple: “Good,” “Caution,” or “Bad.” In the article’s description, green means good, yellow means caution, and red means problems have been detected.
Those labels are useful because most users do not want to interpret a full table of storage telemetry. They are also not a substitute for backups or professional recovery planning. A “Good” status is not a promise that a drive cannot fail, and a warning should be treated as a trigger for data protection rather than an invitation to wait for a worse color.
The MakeUseOf author pays particular attention to “Reallocated Sectors Count.” When a hard disk encounters defective sectors, it can remap data to spare areas. A rising count can indicate that the media is deteriorating, although interpretation depends on the device and the pattern over time.
The author says CrystalDiskInfo warnings led to the replacement of two hard drives, with data moved before either drive failed completely. That anecdote captures the real value of predictive monitoring: not perfect prediction, but additional time to act.
For SSDs, the article highlights “Total Host Writes,” a lifetime-write metric that helps put accumulated use in context. It should not be treated as a countdown clock by itself, but it contributes to a broader picture that may include the drive’s health status, temperature, age, workload, and vendor-specific endurance reporting.
CrystalDiskInfo also demonstrates why CHKDSK and SMART-oriented monitoring should not be treated as interchangeable. CHKDSK examines the drive’s file-system and disk structures for errors it can address or mark. CrystalDiskInfo reads health information reported by the storage device. One can find a logical problem while the other surfaces evidence of physical deterioration; either can be relevant without making the other redundant.
A storage warning changes the order of operations. Back up important data before benchmarking, stress testing, repeated repairs, or attempts to squeeze more service from a suspect drive.
The order is deliberately conservative. It minimizes unnecessary changes to the machine before evidence has been collected. That is important because every repair, cleanup, restart, update, or configuration change can alter the state administrators are trying to understand.
It also prevents category errors. Resource Monitor investigates active software demand; HWiNFO investigates hardware conditions; Windows Memory Diagnostic tests memory; CrystalDiskInfo evaluates storage-health reporting. Wintoys initiates repairs, while Device Performance & Health provides a broad warning layer.
No single tool wins because the tools are not competing to answer the same question.
The Lightroom example correlates sluggishness with heavy writes from a named application and its catalog activity. The HWiNFO example correlates gaming load with a CPU temperature of 90°C. Windows Memory Diagnostic correlates unstable behavior with a testable memory condition, while CrystalDiskInfo can correlate storage trouble with reported health warnings.
That distinction matters in support environments where “the PC is slow” can otherwise lead to an unstructured chain of updates, cleanups, reinstalls, and hardware purchases. A reproducible correlation gives the next technician something concrete: the slowdown occurs during a specific workload, a named process produces the disk traffic, temperatures rise at the same time, or the drive reports a deteriorating attribute.
It also makes remediation safer. Moving an Adobe Lightroom catalog is a targeted response to observed disk activity. Replacing fans is a targeted response to demonstrated heat under load. Backing up and replacing a drive is a targeted response to storage-health warnings.
By contrast, generic “PC cleaner” behavior frequently changes many variables without establishing which one mattered. Even if the computer improves, the user learns little about the cause, and the problem may return because the underlying condition was never identified.
The disciplined approach is slower for the first few minutes and faster over the life of the incident. Observe first, change one relevant variable, and test again.
The tools can also produce information that is easy to overinterpret. A high resource percentage is not automatically abnormal. A sensor value without workload context may be misleading. A successful memory test does not explain every crash, and a “Good” drive status does not remove the need for backups.
The 20-percent free-space recommendation is a useful example of the difference between guidance and proof. Freeing space may improve a constrained system and is generally sensible maintenance, but the percentage alone does not identify every storage bottleneck. A drive can have ample free space and still be overloaded by background writes or affected by a developing hardware problem.
Likewise, a repair tool reporting that it corrected files does not prove those files caused the original slowdown. The user must return to the same workload and see whether the symptom has changed.
There is also a supply-chain consideration with any third-party utility. Users should obtain HWiNFO, Wintoys, and CrystalDiskInfo from the distribution sources identified by their developers or the established channel described in the source material. Search advertisements, imitation download pages, repackaged installers, and unrelated “driver updater” bundles can turn a performance investigation into a security incident.
For businesses, downloading a free tool is only the first governance question. Licensing, software approval, data handling, administrative privileges, update practices, and the retention of sensor or diagnostic logs may all matter. A utility being free for a home user does not automatically settle its terms for organizational deployment.
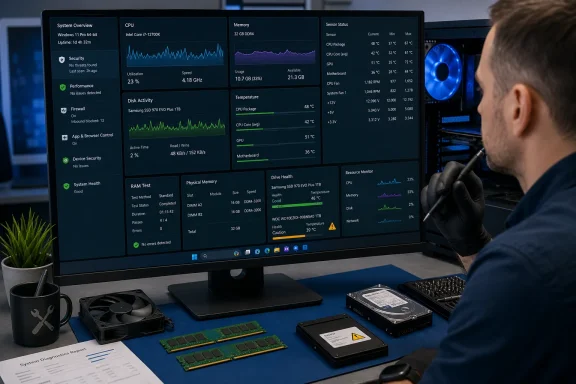 A Slow PC Is a Symptom, Not a Diagnosis
“Slow” is one of the least useful descriptions in computer troubleshooting. It can mean applications take too long to open, games stutter after several minutes, file copies freeze, the desktop stops responding, or the entire machine feels delayed even though Task Manager appears calm.Those symptoms do not necessarily share a cause. A nearly full system drive, a program rebuilding a database, defective memory, thermal throttling, corrupted Windows files, and a deteriorating hard disk can all produce some version of the same complaint. Buying more RAM will not rescue a failing drive, cleaning temporary files will not repair faulty memory, and reinstalling Windows will not fix inadequate cooling.
That is why the six-tool collection highlighted by MakeUseOf is more useful as a sequence than as a list. Windows Device Performance & Health provides broad triage. Windows Resource Monitor identifies active contention. Windows Memory Diagnostic tests RAM. HWiNFO exposes temperatures and other hardware sensor data. Wintoys makes Windows repair utilities easier to reach, while CrystalDiskInfo concentrates on storage-device health.
The result is not a replacement for professional hardware testing. It is a way to make the first round of troubleshooting rational, repeatable, and considerably less vulnerable to placebo fixes.
Windows’ Simplest Dashboard Is a Triage Tool, Not a Verdict
The sensible starting point is Windows Device Performance & Health, the built-in dashboard reached by searching for “Windows Security” and selecting “Device performance & health.” Microsoft’s own support documentation describes the page as an overview of storage capacity, battery life, application or software problems, and the Windows Time service.That scope explains both the feature’s usefulness and its limitation. It can tell a user that a broad category needs attention, but it is not designed to identify every process, file, component, or sensor responsible for a slowdown. A green checkmark means the dashboard has not identified a problem in the categories it covers; it does not certify that every part of the PC is healthy.
The MakeUseOf author begins by looking for yellow warning icons, then selecting “See more info” when the dashboard flags an issue. That is an appropriate workflow because the page excels at directing nontechnical users toward an actionable Windows setting rather than confronting them with raw counters.
Storage capacity is the obvious example. The author says Windows needs at least 20 percent of the storage drive free to run efficiently, but that figure should be understood as the author’s operating rule rather than a universal Microsoft requirement. The practical principle is still sound: Windows, applications, browsers, creative tools, updates, caches, and virtual memory all need working room, and performance can deteriorate when a system drive is severely constrained.
The same dashboard can surface abnormal battery use on a laptop and suggest corrective action. That does not make it a full battery-analysis suite, but it makes it an effective first stop when reduced runtime and sluggish behavior appear together.
The diagnostic mistake would be to stop here. Device Performance & Health answers, “Has Windows noticed a broad health concern?” It does not fully answer, “What is the machine doing at the moment it becomes slow?”
Resource Monitor Finds the Work Hidden Behind the Percentage
Task Manager is where most Windows users look first, and the keyboard shortcut Ctrl + Shift + Esc makes it easy to reach. Its “Performance” tab is excellent for confirming that CPU, memory, disk, or network activity is elevated, but its high-level graphs can leave the crucial question unanswered: which operation is producing the pressure, and what is it touching?Windows Resource Monitor closes that gap. It can be launched by searching for “resmon” or by opening Task Manager, selecting the “Performance” tab, and clicking “Open Resource Monitor.” Microsoft’s troubleshooting guidance also directs users to Resource Monitor when they need to inspect resource consumption in more detail.
The “Overview” tab combines CPU, memory, disk, and network activity, which makes it especially useful when the source of a slowdown is not obvious. A frozen application may actually be waiting for storage. A background process that uses little CPU may still be generating enough disk traffic to make every foreground task feel unresponsive.
MakeUseOf’s Adobe Lightroom example demonstrates why this distinction matters. The author found Adobe Lightroom generating substantial writes in “Processes with Disk Activity” on the “Disk” tab even when the application did not appear to be in active use. Lightroom Classic was reportedly rebuilding previews and updating catalogs in the background.
Task Manager could have shown that the disk was busy. Resource Monitor exposed the application responsible and helped connect that activity to the files being accessed. The author then moved the catalog and preview files to a secondary drive and changed Lightroom’s default location for them.
That is real diagnosis: observation, attribution, intervention, and verification. It is categorically different from ending random tasks until the machine briefly feels faster.
Resource Monitor is also where users should resist the temptation to treat all background activity as malicious or unnecessary. Windows and legitimate applications perform indexing, synchronization, maintenance, updates, database work, and cache management without keeping a large window on screen. High activity becomes meaningful when it correlates with the slowdown and persists long enough to explain the symptom.
For administrators, that correlation is the key. Capture what the system is doing while the complaint is occurring. A screenshot taken after the disk queue has cleared or the CPU spike has ended can turn an observable problem back into a mystery.
Memory Diagnostic Tests the Hardware Behind Unreliable Behavior
Faulty RAM is a different class of problem because it can corrupt the evidence users rely on. A system with memory errors may freeze, crash, display blue screens, damage data, or behave inconsistently enough to make an application look responsible one day and Windows the next.Windows Memory Diagnostic provides a built-in test without requiring another download. Press Win + R, enter “mdsched.exe,” and select “Restart now and check for problems” when immediate testing is appropriate. Because the utility runs during a reboot, it can examine memory outside the normal Windows desktop environment.
For a more thorough pass, the MakeUseOf author recommends pressing F1 during the test and selecting “Extended” testing, with additional passes where needed. The trade-off is time: deeper testing takes longer, but intermittent memory faults are precisely the sort of defects a quick pass may not expose.
After Windows starts again, results can be found through Event Viewer. Press Win + X, open “Event Viewer,” expand “Windows Logs,” select “System,” press Ctrl + F, and search for “MemoryDiagnostics-Results.”
That final retrieval step matters because users often see a test complete, return to Windows, and assume that no visible warning means nothing was found. A diagnostic process is not complete until the result has been located and recorded.
Even then, a clean result should be interpreted carefully. One successful run reduces suspicion; it does not make every possible intermittent hardware problem impossible. If crashes or corruption continue, the correct response is to retain the result as one piece of evidence and broaden the investigation rather than repeatedly running the same test in hope of a different answer.
In a managed environment, record the user’s original symptom, the selected test mode, whether the test completed, and the Event Viewer result. Without that context, “memory test passed” can become a dead-end note rather than a useful troubleshooting data point.
HWiNFO Reveals the Thermal Problem Windows Can Feel but Not Explain
Resource Monitor is excellent at showing what software requests from the system. It cannot, by itself, explain why a processor delivering heavy utilization is operating below its expected performance or why a gaming PC slows down only after it has been under load for several minutes.That is where HWiNFO earns its place. The utility provides detailed hardware information and real-time sensor monitoring for temperatures, voltages, fan speeds, clocks, and other component data. HWiNFO’s official project documentation emphasizes both live monitoring and sensor logging, making it useful for problems that appear only under sustained workloads.
The MakeUseOf workflow uses the Installer option and a standard 64-bit installation. On launch, the “Summary” window presents the hardware configuration, while the “Sensors” window supplies the live readings. In the article’s description, green values are normal, yellow indicates caution, and red means immediate attention is needed.
The author reports seeing a CPU reach 90°C while gaming and replacing the computer’s fans before damage occurred. The larger lesson is not that one temperature automatically proves a particular cooling fault. It is that a performance complaint occurring during gaming can be correlated with a thermal condition that only appears under load.
A PC can feel fast when first turned on and slow later because heat accumulates. If the system reduces performance to control temperature, closing applications or clearing storage may produce no lasting improvement. The machine is not short of theoretical processing power; it is unable to sustain that power under its current thermal conditions.
Logging is particularly valuable here. A user watching the “Sensors” window after exiting a game may see temperatures falling and miss the peak that coincided with the slowdown. A recorded session can reveal whether the symptom appeared alongside rising temperature, changing fan behavior, or reduced operating clocks.
HWiNFO also introduces an important diagnostic discipline: sensor readings require context. A value must be considered alongside the workload, the component, the cooling design, and the behavior over time. The most useful evidence is usually not a single colorful number but a repeatable pattern: start the workload, observe the symptom, capture the sensors, stop the workload, and compare.
Wintoys Makes Repair Accessible but Cannot Decide When Repair Is Justified
Wintoys occupies a different position in this toolkit. It is distributed through the Microsoft Store and brings a selection of Windows controls and diagnostics into a cleaner interface. Its dashboard includes live CPU, GPU, and memory graphs, while the “Health” section leads to “Repair.”From there, the application exposes DISM, SFC, and CHKDSK through straightforward controls. As summarized by MakeUseOf, DISM repairs the core Windows system image, SFC scans and fixes individual system files, and CHKDSK checks hard drives for errors and bad sectors.
Convenience is Wintoys’ strength. Windows has long included capable maintenance utilities, but they are scattered across interfaces and often invoked from command-line environments that discourage inexperienced users. A consolidated dashboard lowers that barrier.
Convenience is not diagnosis, however. Wintoys does not eliminate the need to establish whether file corruption or disk errors plausibly explain the complaint. Running every repair utility whenever a PC feels slow can waste time, complicate support records, and encourage users to confuse activity with progress.
The correct place for Wintoys is after initial observation. If Windows features fail, system components behave inconsistently, or other evidence points toward damaged files, its one-click access can be useful. If Resource Monitor shows that Lightroom is saturating a drive with legitimate background writes, repairing the Windows image addresses a different problem.
The flame icon on the dashboard can run a quick system benchmark after checks or changes. That can help compare the machine’s apparent performance before and after an intervention, but a benchmark should not replace reproduction of the original symptom. A higher score is less persuasive than confirmation that the file copy, application launch, or workload that previously stalled now completes normally.
Wintoys is therefore best understood as an orchestration layer. It simplifies access to repair mechanisms that already exist, but it cannot supply the judgment required to choose the right mechanism.
CrystalDiskInfo Turns “Slow Storage” Into a Data-Safety Question
Storage problems deserve special treatment because the consequence can be larger than poor performance. If a drive is failing, the first priority is no longer making Windows feel faster. It is protecting data before the device becomes unreadable.CrystalDiskInfo specializes in drive health. The MakeUseOf article directs users to obtain it through SourceForge, extract the package, and run DiskInfo64.exe for the 64-bit version. The official Crystal Dew World project describes CrystalDiskInfo as an HDD and SSD utility with support for a range of storage interfaces, while also documenting that controller and enclosure compatibility can vary.
Its first layer of interpretation is deliberately simple: “Good,” “Caution,” or “Bad.” In the article’s description, green means good, yellow means caution, and red means problems have been detected.
Those labels are useful because most users do not want to interpret a full table of storage telemetry. They are also not a substitute for backups or professional recovery planning. A “Good” status is not a promise that a drive cannot fail, and a warning should be treated as a trigger for data protection rather than an invitation to wait for a worse color.
The MakeUseOf author pays particular attention to “Reallocated Sectors Count.” When a hard disk encounters defective sectors, it can remap data to spare areas. A rising count can indicate that the media is deteriorating, although interpretation depends on the device and the pattern over time.
The author says CrystalDiskInfo warnings led to the replacement of two hard drives, with data moved before either drive failed completely. That anecdote captures the real value of predictive monitoring: not perfect prediction, but additional time to act.
For SSDs, the article highlights “Total Host Writes,” a lifetime-write metric that helps put accumulated use in context. It should not be treated as a countdown clock by itself, but it contributes to a broader picture that may include the drive’s health status, temperature, age, workload, and vendor-specific endurance reporting.
CrystalDiskInfo also demonstrates why CHKDSK and SMART-oriented monitoring should not be treated as interchangeable. CHKDSK examines the drive’s file-system and disk structures for errors it can address or mark. CrystalDiskInfo reads health information reported by the storage device. One can find a logical problem while the other surfaces evidence of physical deterioration; either can be relevant without making the other redundant.
A storage warning changes the order of operations. Back up important data before benchmarking, stress testing, repeated repairs, or attempts to squeeze more service from a suspect drive.
The Six Tools Form an Escalation Path, Not a Utility Contest
The collection works because each tool answers a different question. The strongest workflow moves from broad, low-risk observation toward deeper tests and repair only when the evidence justifies it.| Tool | Primary question | Built into Windows | Key entry point | Best evidence produced | Appropriate next move |
|---|---|---|---|---|---|
| Windows Device Performance & Health | Has Windows detected a broad health issue? | Yes | Search “Windows Security” | Storage, battery, app, or time-service warnings | Open “See more info” and investigate the flagged category |
| Windows Resource Monitor | Which process is consuming resources now? | Yes | Run “resmon” | Per-process CPU, memory, disk, and network activity | Correlate the process and files with the slowdown |
| Windows Memory Diagnostic | Could faulty RAM explain instability? | Yes | Run “mdsched.exe” | Memory-test result recorded in Windows | Review “MemoryDiagnostics-Results” in Event Viewer |
| HWiNFO | Is hardware behavior changing under load? | No | Open “Summary” and “Sensors” | Live and logged temperatures, voltages, fans, and other sensors | Compare sensor changes with the workload and symptom |
| Wintoys | Do Windows repair utilities need to be run? | No | “Health” then “Repair” | Results from DISM, SFC, and CHKDSK | Reproduce the original problem after repair |
| CrystalDiskInfo | Is a storage device reporting health concerns? | No | Run DiskInfo64.exe | Drive status and SMART-related attributes | Back up first if “Caution” or “Bad” appears |
It also prevents category errors. Resource Monitor investigates active software demand; HWiNFO investigates hardware conditions; Windows Memory Diagnostic tests memory; CrystalDiskInfo evaluates storage-health reporting. Wintoys initiates repairs, while Device Performance & Health provides a broad warning layer.
No single tool wins because the tools are not competing to answer the same question.
Action checklist for admins
- Record the exact symptom, affected application, workload, and time before changing the PC.
- Open “Device performance & health” in Windows Security and document any yellow warnings.
- Reproduce the slowdown while Resource Monitor is open, then inspect the “Overview” and “Disk” tabs.
- If crashes, freezes, or blue screens accompany the slowdown, schedule Windows Memory Diagnostic and retrieve “MemoryDiagnostics-Results” afterward.
- Use HWiNFO’s “Sensors” window during the affected workload and log readings when the problem is intermittent.
- Check CrystalDiskInfo before running storage-heavy tests; if it reports “Caution” or “Bad,” protect the data first.
- Use Wintoys repairs only when the symptoms or earlier checks support a Windows-image, system-file, or disk-error hypothesis.
- Reproduce the original workload after each meaningful change rather than making several changes at once.
The Most Valuable Result Is a Correlation You Can Repeat
The common thread across these utilities is not optimization. It is correlation.The Lightroom example correlates sluggishness with heavy writes from a named application and its catalog activity. The HWiNFO example correlates gaming load with a CPU temperature of 90°C. Windows Memory Diagnostic correlates unstable behavior with a testable memory condition, while CrystalDiskInfo can correlate storage trouble with reported health warnings.
That distinction matters in support environments where “the PC is slow” can otherwise lead to an unstructured chain of updates, cleanups, reinstalls, and hardware purchases. A reproducible correlation gives the next technician something concrete: the slowdown occurs during a specific workload, a named process produces the disk traffic, temperatures rise at the same time, or the drive reports a deteriorating attribute.
It also makes remediation safer. Moving an Adobe Lightroom catalog is a targeted response to observed disk activity. Replacing fans is a targeted response to demonstrated heat under load. Backing up and replacing a drive is a targeted response to storage-health warnings.
By contrast, generic “PC cleaner” behavior frequently changes many variables without establishing which one mattered. Even if the computer improves, the user learns little about the cause, and the problem may return because the underlying condition was never identified.
The disciplined approach is slower for the first few minutes and faster over the life of the incident. Observe first, change one relevant variable, and test again.
Free Diagnostics Still Have Blind Spots
This toolkit is broad, but it is not comprehensive. It does not automatically rule out malware, defective power delivery, driver faults, firmware problems, network latency, application bugs, or a storage controller that prevents health information from being read correctly.The tools can also produce information that is easy to overinterpret. A high resource percentage is not automatically abnormal. A sensor value without workload context may be misleading. A successful memory test does not explain every crash, and a “Good” drive status does not remove the need for backups.
The 20-percent free-space recommendation is a useful example of the difference between guidance and proof. Freeing space may improve a constrained system and is generally sensible maintenance, but the percentage alone does not identify every storage bottleneck. A drive can have ample free space and still be overloaded by background writes or affected by a developing hardware problem.
Likewise, a repair tool reporting that it corrected files does not prove those files caused the original slowdown. The user must return to the same workload and see whether the symptom has changed.
There is also a supply-chain consideration with any third-party utility. Users should obtain HWiNFO, Wintoys, and CrystalDiskInfo from the distribution sources identified by their developers or the established channel described in the source material. Search advertisements, imitation download pages, repackaged installers, and unrelated “driver updater” bundles can turn a performance investigation into a security incident.
For businesses, downloading a free tool is only the first governance question. Licensing, software approval, data handling, administrative privileges, update practices, and the retention of sensor or diagnostic logs may all matter. A utility being free for a home user does not automatically settle its terms for organizational deployment.
What to Remember Before Replacing the PC
The practical lesson is that Windows performance troubleshooting should move from the cheapest observation to the most consequential intervention. Most users do not need to begin with a reinstall, an upgrade, or a repair shop; they need to determine whether the bottleneck is space, activity, memory, heat, file integrity, or storage health.- Begin with Windows Device Performance & Health for broad warnings, but do not treat green checks as a complete hardware certification.
- Use Resource Monitor during the slowdown to identify the process and files behind CPU, memory, disk, or network activity.
- Test RAM when poor performance arrives with freezes, crashes, blue screens, or inconsistent behavior.
- Run HWiNFO under the workload that causes the problem, because thermal trouble may disappear when the PC returns to idle.
- Treat CrystalDiskInfo warnings as data-protection events, especially when “Reallocated Sectors Count” is increasing.
- Use Wintoys to simplify justified repairs, not as a substitute for establishing what is broken.
References
- Primary source: MakeUseOf
Published: Sun, 12 Jul 2026 13:16:17 GMT
Loading…
www.makeuseof.com - Official source: support.microsoft.com
Loading…
support.microsoft.com - Related coverage: snia.org
Loading…
www.snia.org - Official source: learn.microsoft.com
Loading…
learn.microsoft.com - Related coverage: windowscentral.com
Loading…
www.windowscentral.com - Related coverage: pcgamer.com
Loading…
www.pcgamer.com