

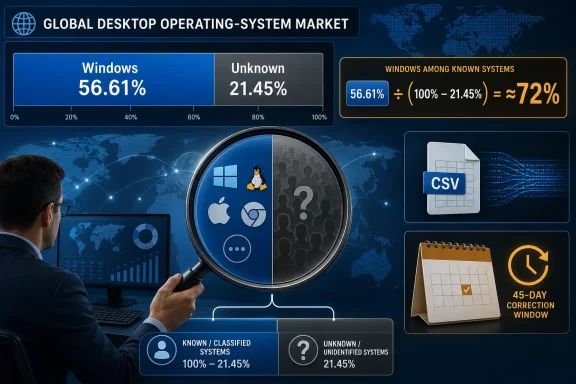
According to Korben’s reporting on StatCounter’s June 2026 data, Windows reportedly stood at 56.61% of worldwide desktop operating-system observations, while the same table reportedly assigned 21.45% to “Unknown.” Korben also reported that a downloaded CSV produced a Windows result of approximately 72%. The difference turns an apparent collapse into a dispute over classification and denominators.
The short verdict: the reported 56.61% figure includes Unknown in the denominator; the approximately 72% result describes Windows among identified operating systems; neither is installed-PC share.
The calculation using the reported table figures is straightforward:
This analysis compares StatCounter’s reported categories and the effects of different denominator treatment. It is not independent evidence of either the actual composition of Unknown or the reason that category increased.
The headline number is real in the narrowest sense: according to Korben’s account of the StatCounter table, Windows reportedly stood at 56.61% for June 2026. Directly below it, Unknown reportedly stood at 21.45%.
Unknown is not an operating system that users can install, purchase, administer, or migrate to. Here, it is an unresolved measurement category rather than another platform competing for users. Displaying it beside named platforms may be useful for accounting for the full dataset, but readers should not treat it as a conventional operating-system rival.
Korben’s analysis identified an important difference between two presentations of the same month. The visible StatCounter table reportedly showed Windows at 56.61%, while a CSV downloaded from StatCounter reportedly produced a Windows result of approximately 72%.
Those figures answer different questions.
The reported 56.61% figure asks: what proportion of the full table was assigned to Windows when Unknown remained part of the total?
The approximately 72% calculation asks: among observations assigned to a recognized operating system, what proportion was Windows?
The second result resembles what many readers expect from the phrase “desktop operating-system market share,” but it is not automatically a definitive estimate of the underlying platform population. Excluding Unknown assumes that the remaining named categories provide a useful basis for comparison despite the unusually large unresolved portion.
If Unknown contains platforms in substantially different proportions from the classified portion, the normalized calculation could either understate or overstate individual operating systems. The supplied data does not reveal that composition.
That is why the reported 56.61% is not, by itself, proof that Windows suddenly collapsed, while approximately 72% should not be mistaken for a census of the world’s computers. One result retains unidentified observations in the denominator; the other compares only named categories.
Windows therefore appeared to lose slightly more than 13 percentage points while the unidentified category gained roughly 12 points. As Korben observed, the movements were close to mirror images.
That correlation does not prove that most Unknown observations came from Windows systems. The available figures do not identify the operating systems represented inside Unknown, and they do not establish why the category changed.
The relationship does mean that analysts should treat the classification issue as part of the story before converting the raw movement into evidence that a corresponding portion of desktop users migrated away from Windows. An abrupt decline in a named category that closely accompanies a surge in unresolved observations is both a market-share question and a measurement question.
The problem is not that reporters cited the visible table. The problem arises when a figure from that table is converted into a claim about the installed PC market without preserving its denominator and uncertainty.
StatCounter’s reported figures describe activity visible to its measurement system. They do not directly count computers, licenses, enterprise endpoints, hardware shipments, or unique people. With Unknown reportedly at 21.45%, that distinction is a structural part of the June result rather than a minor caveat.
That is a measured difference of 5.22 percentage points under this calculation. It is substantially smaller than the raw-table decline, but a one-year comparison alone does not prove that a settled, durable market shift of exactly that size has occurred. Establishing such a trend would require consistent readings across multiple months and, ideally, corroboration from datasets using different methods.
The adjusted comparison also produces gains for named competitors. Based on the reported source figures, Linux rises from 4.50% to 5.59%, while Apple’s combined adjusted share increases from 16.90% to 20.87%.
These are calculated comparisons derived from StatCounter figures reportedly presented for the two months. They provide a more qualified account than the raw decline: Windows remained the largest named platform in this comparison, but its normalized share was lower than one year earlier. Apple recorded the largest measured gain among the listed platform groups, while Linux recorded a smaller increase.
Those differences may represent genuine changes, measurement effects, or a combination of factors. They are worth monitoring, but a two-point-in-time comparison should not be promoted into an unquestionable long-term trend.
The contrast still matters strategically. If the approximately 72% classified result accurately reflects a durable pattern, it describes a different competitive environment from a literal reading of the reported 56.61% raw figure. Decisions about software support, testing, procurement, or migration should not depend on choosing whichever denominator creates the most dramatic narrative.
The adjusted figures also change how Linux’s progress should be discussed. Its calculated increase from 4.50% to 5.59% is notable within the normalized comparison, but Linux did not absorb anything close to the entire raw decline attributed to Windows.
Apple’s adjusted gain is larger, and the reported increase in Unknown is larger still. An account framed primarily as Windows users switching to Linux would therefore go beyond what these figures establish.
Hacker News discussions cited by Korben proposed several theories: AI scrapers that do not send conventional identifying information, bots that imitate common clients, and browsers that deliberately reduce fingerprintable platform details. These remain unproven explanations for the June 2026 reading.
The important point is not to choose a favored theory without evidence. The reported category may have one cause or several, and the supplied information does not establish how much of Unknown should be associated with Windows, Apple, Linux, automation, privacy-related behavior, or anything else.
That uncertainty makes Unknown analytically difficult. Treating it as a competing platform gives an unresolved category more meaning than the source data supports. Removing it improves comparison among the named platforms but can obscure the scale of the unresolved portion. Assigning it wholesale to Windows, Apple, or Linux would be less defensible still.
The practical response is to publish the classified share and the unclassified rate together and avoid converting either result into a claim about installed systems without corroborating evidence.
A jump of that size would have represented an extraordinary reversal for an obsolete operating system. The historical September value visible later was reportedly 1.62%, producing a very different interpretation.
That episode does not establish the cause of the June 2026 Unknown surge. It does show that a surprising initial reading may not remain the final historical value.
StatCounter reportedly maintains a 45-day period during which recent figures can be corrected. The journalistic consequence is straightforward: early numbers should be labeled provisional, particularly when they create an abrupt discontinuity or a supposedly historic threshold.
June’s figures could therefore remain subject to change until approximately mid-August 2026. Outlets do not need to ignore the data during that period, but they should distinguish an initial reading from a settled historical series.
Market-share reporting has an asymmetry problem. Anomalies attract attention because they are surprising; later normalization is often treated as routine maintenance. Readers may remember the dramatic first number even after the underlying series changes.
The remedy is procedural rather than rhetorical: preserve the original data, record the retrieval date, disclose the revision window, and return after that window closes.
July 2025 — StatCounter reportedly placed Windows 7 at 0.88% share.
September 2025 — The measurement month for the anomalous Windows 7 reading later discussed in coverage. The initially reported figure was 9.61%; the historical value visible afterward was reportedly 1.62%.
October 2025 — Coverage reported the unusual 9.61% Windows 7 figure for September 2025. Windows 10 also reached its stated end-of-support point during October 2025.
June 2026 — The StatCounter table reportedly placed Windows at 56.61% and Unknown at 21.45%. Korben reported that a downloaded CSV produced a Windows result of approximately 72%.
Early July 2026 — Unknown was reportedly displayed at 23.67%, reinforcing the need to monitor the category rather than assume a cause.
Mid-August 2026 — June’s figures would be expected to pass beyond StatCounter’s reported 45-day correction period around this point.
Windows 11 refuses some older machines, making hardware age and compatibility relevant to migration planning. Windows 10 reached end of support in October 2025, while Extended Security Update patches continue through October 2027. End of support does not cause installed machines to vanish immediately, especially in organizations dependent on specialized applications or equipment. It does, however, require decisions about risk, support, procurement, and migration.
Linux may receive consideration among technically confident users during a Windows transition, but the StatCounter figures do not establish why Linux’s adjusted share increased or which users, if any, moved from Windows.
Organizations must account for line-of-business software, specialized peripherals, accessibility tools, creative applications, identity systems, policy enforcement, packaging, compliance, training, and vendor support. A migration decision involves much more than comparing public market-share percentages.
Apple follows a different decision path because organizations or individuals replacing computers may compare complete devices and their associated ecosystems. Within this normalized one-year comparison, Apple records a larger measured gain than Linux, but the figures do not reveal the reasons.
The available data is therefore consistent with the possibility of a more competitive desktop environment, but it does not establish that roughly one in eight desktop users abandoned Windows in a single year.
That does not make StatCounter’s data useless. It makes the data suitable for monitoring patterns within StatCounter’s reported observations, provided the classification rate, denominator, and provisional status remain attached.
The one-year normalized difference is a signal to monitor, not a substitute for a multi-month trend. Confidence would increase if the movement persisted after the correction window, appeared across neighboring months, and aligned with independent datasets based on different methods.
The Unknown surge requires the same discipline. It may eventually prove temporary or persistent, but the supplied facts do not establish its cause. Until the category is better understood, analysts should resist both extremes: declaring that Windows has collapsed and dismissing every measured decline as meaningless.
Internal fleet decisions must instead be grounded in device-management records, directory data, software inventories, security tooling, procurement records, and support requirements. Public statistics can provide context, but they cannot replace evidence about an organization’s own endpoints.
At a low level, Unknown may be treated as residual uncertainty. At a reported 21.45%, it materially affects the apparent position, trajectory, and scale of every named platform.
The June table did not merely indicate that Windows reportedly accounted for 56.61% of the full result. It also indicated that more than one fifth of the result was not assigned to a named operating system. Reporting the first number without the second converts a classification result into an overly confident market verdict.
Korben’s report about the downloaded CSV created a second interpretive path by presenting a Windows result of approximately 72%. That result is useful, but it must be labeled as a known-OS comparison rather than silently substituted for the visible table figure. Readers can otherwise encounter materially different Windows percentages for the same month without understanding why.
A clear reporting model places three values together:
For now, the responsible conclusion is narrower than the most dramatic headline and more useful than simply discarding the dataset. According to Korben’s reporting on StatCounter, Windows stood at 56.61% in the June 2026 worldwide desktop table, while Unknown stood at 21.45%. Excluding Unknown from the arithmetic produces a Windows share of approximately 72% among identified operating systems. That calculated result was 5.22 points below June 2025, but a one-year difference is not, by itself, proof of a settled shift of the same magnitude.
Windows may be losing relative share within StatCounter’s classified observations. Apple and Linux may be gaining. The June figures provide reasons to monitor those possibilities, not permission to ignore the unresolved fifth of the dataset or treat public measurements as a device census.
The next meaningful milestone is therefore not whether a revised chart places Windows above or below an attention-grabbing threshold. It is whether the June result survives StatCounter’s reported 45-day correction window, persists across subsequent months, and agrees with independent evidence. Until then, the denominator—not the headline—is the most important part of the story.
The short verdict: the reported 56.61% figure includes Unknown in the denominator; the approximately 72% result describes Windows among identified operating systems; neither is installed-PC share.
The calculation using the reported table figures is straightforward:
The lower number reflects the full reported table, and the higher number can be calculated from the classified portion of that table. Neither should be presented without the other when more than one fifth of the observations are unidentified.Known operating systems: 100% − 21.45% Unknown = 78.55%
Windows among known operating systems: 56.61% ÷ 78.55% = approximately 72%
This analysis compares StatCounter’s reported categories and the effects of different denominator treatment. It is not independent evidence of either the actual composition of Unknown or the reason that category increased.
This is not merely a statistical footnote. When the unidentified category becomes larger than every named rival except Windows, the denominator becomes central to the result.What to do with this number
Use a three-number reporting standard:
Archive and recheck: Save the displayed table and downloaded CSV with the retrieval date, state which denominator each figure uses, mark the data provisional during StatCounter’s reported 45-day correction window, and recheck it after that period.
- Reported raw Windows share: 56.61%
- Reported Unknown rate: 21.45%
- Calculated Windows share among known operating systems: approximately 72%
Executive-report wording: “StatCounter reportedly placed Windows at 56.61% in its June 2026 worldwide desktop table, with 21.45% classified as Unknown. Windows represented approximately 72% of the identified operating systems after Unknown was excluded from the calculation. These figures measure StatCounter’s observed activity, not installed PCs or the organization’s own device fleet.”
 Windows Did Not Lose 13 Points in Isolation
The headline number is real in the narrowest sense: according to Korben’s account of the StatCounter table, Windows reportedly stood at 56.61% for June 2026. Directly below it, Unknown reportedly stood at 21.45%.Unknown is not an operating system that users can install, purchase, administer, or migrate to. Here, it is an unresolved measurement category rather than another platform competing for users. Displaying it beside named platforms may be useful for accounting for the full dataset, but readers should not treat it as a conventional operating-system rival.
Korben’s analysis identified an important difference between two presentations of the same month. The visible StatCounter table reportedly showed Windows at 56.61%, while a CSV downloaded from StatCounter reportedly produced a Windows result of approximately 72%.
Those figures answer different questions.
The reported 56.61% figure asks: what proportion of the full table was assigned to Windows when Unknown remained part of the total?
The approximately 72% calculation asks: among observations assigned to a recognized operating system, what proportion was Windows?
The second result resembles what many readers expect from the phrase “desktop operating-system market share,” but it is not automatically a definitive estimate of the underlying platform population. Excluding Unknown assumes that the remaining named categories provide a useful basis for comparison despite the unusually large unresolved portion.
If Unknown contains platforms in substantially different proportions from the classified portion, the normalized calculation could either understate or overstate individual operating systems. The supplied data does not reveal that composition.
That is why the reported 56.61% is not, by itself, proof that Windows suddenly collapsed, while approximately 72% should not be mistaken for a census of the world’s computers. One result retains unidentified observations in the denominator; the other compares only named categories.
The Mirror Image Is Too Large to Ignore
The year-over-year comparison makes the raw sub-60% interpretation especially difficult to accept without qualification. According to the StatCounter figures reported by Korben, Windows stood at 70.13% and Unknown at 9.17% in June 2025. By June 2026, Windows had reportedly fallen to 56.61% while Unknown had reportedly risen to 21.45%.Windows therefore appeared to lose slightly more than 13 percentage points while the unidentified category gained roughly 12 points. As Korben observed, the movements were close to mirror images.
That correlation does not prove that most Unknown observations came from Windows systems. The available figures do not identify the operating systems represented inside Unknown, and they do not establish why the category changed.
The relationship does mean that analysts should treat the classification issue as part of the story before converting the raw movement into evidence that a corresponding portion of desktop users migrated away from Windows. An abrupt decline in a named category that closely accompanies a surge in unresolved observations is both a market-share question and a measurement question.
The problem is not that reporters cited the visible table. The problem arises when a figure from that table is converted into a claim about the installed PC market without preserving its denominator and uncertainty.
StatCounter’s reported figures describe activity visible to its measurement system. They do not directly count computers, licenses, enterprise endpoints, hardware shipments, or unique people. With Unknown reportedly at 21.45%, that distinction is a structural part of the June result rather than a minor caveat.
Removing Unknown Clarifies the Comparison but Does Not Settle the Trend
Questioning the raw 56.61% figure as a complete account does not require pretending Windows held steady. If Unknown is excluded consistently from both reported years, Windows declines from a calculated 77.22% in June 2025 to approximately 72% in June 2026.That is a measured difference of 5.22 percentage points under this calculation. It is substantially smaller than the raw-table decline, but a one-year comparison alone does not prove that a settled, durable market shift of exactly that size has occurred. Establishing such a trend would require consistent readings across multiple months and, ideally, corroboration from datasets using different methods.
The adjusted comparison also produces gains for named competitors. Based on the reported source figures, Linux rises from 4.50% to 5.59%, while Apple’s combined adjusted share increases from 16.90% to 20.87%.
| Platform group | June 2025 adjusted share | June 2026 adjusted share | Measured difference |
|---|---|---|---|
| Windows | 77.22% | 72.00% | −5.22 points |
| Apple | 16.90% | 20.87% | +3.97 points |
| Linux | 4.50% | 5.59% | +1.09 points |
Those differences may represent genuine changes, measurement effects, or a combination of factors. They are worth monitoring, but a two-point-in-time comparison should not be promoted into an unquestionable long-term trend.
The contrast still matters strategically. If the approximately 72% classified result accurately reflects a durable pattern, it describes a different competitive environment from a literal reading of the reported 56.61% raw figure. Decisions about software support, testing, procurement, or migration should not depend on choosing whichever denominator creates the most dramatic narrative.
The adjusted figures also change how Linux’s progress should be discussed. Its calculated increase from 4.50% to 5.59% is notable within the normalized comparison, but Linux did not absorb anything close to the entire raw decline attributed to Windows.
Apple’s adjusted gain is larger, and the reported increase in Unknown is larger still. An account framed primarily as Windows users switching to Linux would therefore go beyond what these figures establish.
“Unknown” Is an Unresolved Measurement Category
The obvious question is what the Unknown category contains. The available figures do not provide enough information to identify a dominant cause.Hacker News discussions cited by Korben proposed several theories: AI scrapers that do not send conventional identifying information, bots that imitate common clients, and browsers that deliberately reduce fingerprintable platform details. These remain unproven explanations for the June 2026 reading.
The important point is not to choose a favored theory without evidence. The reported category may have one cause or several, and the supplied information does not establish how much of Unknown should be associated with Windows, Apple, Linux, automation, privacy-related behavior, or anything else.
That uncertainty makes Unknown analytically difficult. Treating it as a competing platform gives an unresolved category more meaning than the source data supports. Removing it improves comparison among the named platforms but can obscure the scale of the unresolved portion. Assigning it wholesale to Windows, Apple, or Linux would be less defensible still.
The practical response is to publish the classified share and the unclassified rate together and avoid converting either result into a claim about installed systems without corroborating evidence.
The Windows 7 Episode Shows Why Rechecks Matter
Earlier StatCounter figures also illustrate the importance of revisiting anomalous readings. Coverage published in October 2025 reportedly discussed a StatCounter figure of 9.61% for Windows 7 in September 2025, compared with a reported July 2025 figure of 0.88% share.A jump of that size would have represented an extraordinary reversal for an obsolete operating system. The historical September value visible later was reportedly 1.62%, producing a very different interpretation.
That episode does not establish the cause of the June 2026 Unknown surge. It does show that a surprising initial reading may not remain the final historical value.
StatCounter reportedly maintains a 45-day period during which recent figures can be corrected. The journalistic consequence is straightforward: early numbers should be labeled provisional, particularly when they create an abrupt discontinuity or a supposedly historic threshold.
June’s figures could therefore remain subject to change until approximately mid-August 2026. Outlets do not need to ignore the data during that period, but they should distinguish an initial reading from a settled historical series.
Market-share reporting has an asymmetry problem. Anomalies attract attention because they are surprising; later normalization is often treated as routine maintenance. Readers may remember the dramatic first number even after the underlying series changes.
The remedy is procedural rather than rhetorical: preserve the original data, record the retrieval date, disclose the revision window, and return after that window closes.
Timeline
June 2025 — StatCounter reportedly placed Windows at 70.13% in the raw table and Unknown at 9.17%. Excluding Unknown produces a calculated Windows share of 77.22% among known operating systems.July 2025 — StatCounter reportedly placed Windows 7 at 0.88% share.
September 2025 — The measurement month for the anomalous Windows 7 reading later discussed in coverage. The initially reported figure was 9.61%; the historical value visible afterward was reportedly 1.62%.
October 2025 — Coverage reported the unusual 9.61% Windows 7 figure for September 2025. Windows 10 also reached its stated end-of-support point during October 2025.
June 2026 — The StatCounter table reportedly placed Windows at 56.61% and Unknown at 21.45%. Korben reported that a downloaded CSV produced a Windows result of approximately 72%.
Early July 2026 — Unknown was reportedly displayed at 23.67%, reinforcing the need to monitor the category rather than assume a cause.
Mid-August 2026 — June’s figures would be expected to pass beyond StatCounter’s reported 45-day correction period around this point.
What Administrators Should Do Now
The data dispute does not resolve any organization’s Windows migration obligations. Administrators need internal telemetry rather than public market-share estimates to determine which systems they own, which operating-system releases those systems run, and which applications or hardware dependencies affect migration.Action checklist for admins
- Inventory Windows 10, Windows 11, macOS, Linux, and unidentified endpoints through management, directory, network, and security tooling.
- Identify older systems that Windows 11 refuses and document an organization-specific plan for them.
- Verify the support and security-update status of every Windows 10 device rather than assuming that continued operation means continued protection.
- Account for Windows 10 Extended Security Updates, whose security patches continue through October 2027.
- Record whether an external statistic retains Unknown or excludes it before using the result in an executive report.
- Include the reported raw Windows share, reported Unknown rate, calculated known-OS share, retrieval date, and provisional status in any report using the June figures.
- Archive the original chart and downloaded CSV so later revisions can be detected.
- Recheck the June data after the reported 45-day correction window.
- Corroborate major shifts with independent telemetry before changing procurement, application-support, or migration strategy.
Windows 11 refuses some older machines, making hardware age and compatibility relevant to migration planning. Windows 10 reached end of support in October 2025, while Extended Security Update patches continue through October 2027. End of support does not cause installed machines to vanish immediately, especially in organizations dependent on specialized applications or equipment. It does, however, require decisions about risk, support, procurement, and migration.
Linux may receive consideration among technically confident users during a Windows transition, but the StatCounter figures do not establish why Linux’s adjusted share increased or which users, if any, moved from Windows.
Organizations must account for line-of-business software, specialized peripherals, accessibility tools, creative applications, identity systems, policy enforcement, packaging, compliance, training, and vendor support. A migration decision involves much more than comparing public market-share percentages.
Apple follows a different decision path because organizations or individuals replacing computers may compare complete devices and their associated ecosystems. Within this normalized one-year comparison, Apple records a larger measured gain than Linux, but the figures do not reveal the reasons.
The available data is therefore consistent with the possibility of a more competitive desktop environment, but it does not establish that roughly one in eight desktop users abandoned Windows in a single year.
Market Share Is Not Fleet Share
For IT departments, the central rule is simple: public activity data cannot answer an internal inventory question.That does not make StatCounter’s data useless. It makes the data suitable for monitoring patterns within StatCounter’s reported observations, provided the classification rate, denominator, and provisional status remain attached.
The one-year normalized difference is a signal to monitor, not a substitute for a multi-month trend. Confidence would increase if the movement persisted after the correction window, appeared across neighboring months, and aligned with independent datasets based on different methods.
The Unknown surge requires the same discipline. It may eventually prove temporary or persistent, but the supplied facts do not establish its cause. Until the category is better understood, analysts should resist both extremes: declaring that Windows has collapsed and dismissing every measured decline as meaningless.
Internal fleet decisions must instead be grounded in device-management records, directory data, software inventories, security tooling, procurement records, and support requirements. Public statistics can provide context, but they cannot replace evidence about an organization’s own endpoints.
The Denominator Is Now the Product
StatCounter’s public charts provide an accessible view of its operating-system observations. That convenience becomes hazardous when readers treat every displayed category as an equivalent slice of a clearly defined installed-device market.At a low level, Unknown may be treated as residual uncertainty. At a reported 21.45%, it materially affects the apparent position, trajectory, and scale of every named platform.
The June table did not merely indicate that Windows reportedly accounted for 56.61% of the full result. It also indicated that more than one fifth of the result was not assigned to a named operating system. Reporting the first number without the second converts a classification result into an overly confident market verdict.
Korben’s report about the downloaded CSV created a second interpretive path by presenting a Windows result of approximately 72%. That result is useful, but it must be labeled as a known-OS comparison rather than silently substituted for the visible table figure. Readers can otherwise encounter materially different Windows percentages for the same month without understanding why.
A clear reporting model places three values together:
- Windows as a share of the full reported table.
- Windows as a calculated share of classified observations.
- The percentage reported as Unknown.
For now, the responsible conclusion is narrower than the most dramatic headline and more useful than simply discarding the dataset. According to Korben’s reporting on StatCounter, Windows stood at 56.61% in the June 2026 worldwide desktop table, while Unknown stood at 21.45%. Excluding Unknown from the arithmetic produces a Windows share of approximately 72% among identified operating systems. That calculated result was 5.22 points below June 2025, but a one-year difference is not, by itself, proof of a settled shift of the same magnitude.
Windows may be losing relative share within StatCounter’s classified observations. Apple and Linux may be gaining. The June figures provide reasons to monitor those possibilities, not permission to ignore the unresolved fifth of the dataset or treat public measurements as a device census.
The next meaningful milestone is therefore not whether a revised chart places Windows above or below an attention-grabbing threshold. It is whether the June result survives StatCounter’s reported 45-day correction window, persists across subsequent months, and agrees with independent evidence. Until then, the denominator—not the headline—is the most important part of the story.
References
- Primary source: Korben
Published: 2026-07-10T09:20:23.451384
Loading…
korben.info - Related coverage: gs.statcounter.com
Loading…
gs.statcounter.com - Related coverage: blog.statcounter.com
Loading…
blog.statcounter.com - Related coverage: tech.yahoo.com
Loading…
tech.yahoo.com - Related coverage: linkedin.com
Loading…
www.linkedin.com - Related coverage: secure.statcounter.com
Loading…
secure.statcounter.com
- Related coverage: linuxstans.com
Loading…
linuxstans.com - Related coverage: borncity.com
Loading…
borncity.com - Official source: microsoft.com
Windows 10 Extended Security Updates | Microsoft Windows
Use Windows 10 securely with the Extended Security Updates program. See how it helps protect your PC and find out how to get it.www.microsoft.com - Related coverage: linux.org
Loading…
www.linux.org - Related coverage: news.tuxmachines.org
Loading…
news.tuxmachines.org - Official source: download.microsoft.com
Windows 10 Upgrade Benefits for Customers with CSP Subscriptions
</rdf:Alt> </dc:description> <dc:creator> <rdf:Seq> <rdf:li>Microsoft Corporationdownload.microsoft.com
- Related coverage: frandroid.com
Loading…
www.frandroid.com - Related coverage: linux-magazine.com
Loading…
www.linux-magazine.com