• Thread Author
Windows 11 will now offer an immediate, one‑click path to check system RAM after an unexpected restart, prompting users to schedule a quick Windows Memory Diagnostic scan the next time the PC reboots.

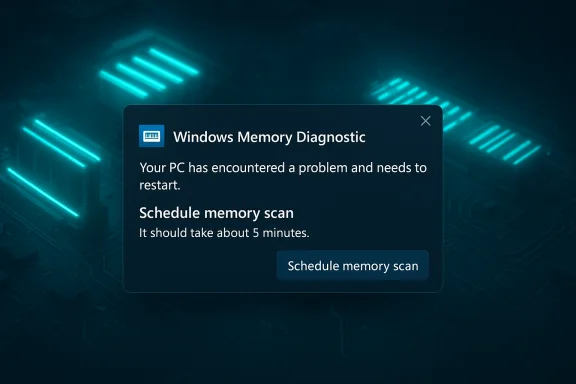
Windows Memory Diagnostic alert on a neon circuit-board background, prompting a memory scan.Background​

Microsoft has begun testing a feature called Proactive Memory Diagnostics in recent Windows Insider Preview builds, surfaced to Insiders in the Dev and Beta channels as part of the cumulative update identified with KB5067109 (Dev build 26220.6982 and Beta build 26120.6982). The goal is to make basic hardware triage for memory faults a native, low‑friction step after a crash (bugcheck) so intermittent RAM problems can be detected and addressed before they cause repeated instability or data corruption.
This change arrives alongside a handful of other small quality‑of‑life updates in the same preview packages — including a new “Copy & Search” quick search for copied text, an adjustable delay option for voice typing, visual adjustments to Device cards in Settings, and refreshed taskbar animations — but the memory prompt is the most consequential for system reliability.

How the post‑crash memory prompt works​

The user flow​

  • When Windows detects a bugcheck (the kernel event that typically causes a BSOD/GSOD or an unexpected restart), it records the crash and proceeds to restart.
  • After the user signs back in, Windows may display a dismissible notification offering to “schedule a quick memory scan” on the next reboot.
  • If the user accepts, the OS schedules the built‑in Windows Memory Diagnostic (mdsched.exe) to run in the pre‑boot environment during the next restart. The scan will run, complete, and then allow Windows to continue booting.
Microsoft describes the scheduled pass as a short triage that takes roughly five minutes or less on average on typical systems. The intent is to give users a fast first check without a lengthy outage; it is not positioned as a replacement for longer, forensic memory tests when deeper problems are suspected.

The underlying tool: Windows Memory Diagnostic (mdsched.exe)​

The diagnostic invoked by this flow is the long‑standing Windows Memory Diagnostic utility (mdsched.exe), which runs in a minimal pre‑OS environment and performs a series of memory tests to detect physical RAM errors or corruption. Historically, the tool reports faulty memory regions and may allow the OS to avoid allocating those pages but does not physically repair hardware — replacement is often required when persistent errors are found.

Why this matters: practical benefits and user impact​

A built‑in, contextually triggered memory check addresses several practical pain points for users and support teams.
  • It provides immediate triage after a crash without requiring users to search for tools or create bootable diagnostics.
  • Early detection of RAM faults can reduce repeated crash loops, prevent file corruption, and make RMA/warranty claims clearer because diagnostic evidence is captured close to the failure event.
  • For many home users, the five‑minute triage pass will be a fast, accessible sanity check before moving into deeper troubleshooting.
From an IT and support perspective, integrating the diagnostic prompt into sign‑in flows should reduce the time help desks spend guiding customers through memory checks and lower the barrier for gathering consistent diagnostic evidence. Enterprises with centralized telemetry and device management will be able to incorporate the new signal into their triage playbooks — provided they accept the feature into managed policies.

Technical limitations and exclusions​

The initial flight of the feature is deliberately constrained and includes several platform and configuration exclusions that matter for both consumers and enterprise fleets.
  • It is available only to Windows Insiders in the Dev and Beta channels in these preview builds; general availability dates are not specified.
  • The prompt is not available on ARM64 devices in the early rollout, leaving Windows on Arm systems out of this convenience for now.
  • Systems with Administrator Protection enabled will not show the prompt; this security model restricts certain automated elevated actions.
  • Devices that use BitLocker but do not enable Secure Boot are excluded from the experience, because the memory diagnostic runs in a pre‑boot environment and must interoperate with encryption and boot security policies.
Beyond platform exclusions, the initial telemetry strategy is intentionally broad: Microsoft has configured the feature to trigger on all bugcheck codes during early testing, so the team can study which crash signatures actually correlate with memory corruption. That broad triggering will likely be narrowed in future builds to reduce unnecessary prompts for crashes unrelated to RAM (for example, driver or firmware bugs).

Strengths of the approach​

  • Low friction for users — the prompt is integrated, dismissible, and schedules the scan for the next reboot without forcing an immediate interruption.
  • Faster time‑to‑diagnosis — catching RAM faults earlier can prevent data loss, repeated crashes, and prolonged troubleshooting sessions.
  • Built on a trusted OS tool — the change uses the existing Windows Memory Diagnostic engine rather than shipping or recommending third‑party utilities, which simplifies support and standardizes results.
These strengths make the feature particularly useful for home users and smaller support operations that lack dedicated hardware diagnostic rigs. The lightweight, automated path should also increase the rate at which hardware‑caused crashes are identified correctly by both users and IT professionals.

Risks, caveats and potential problems​

While the feature is promising, there are several important caveats and risks to consider.
  • Short scans can miss intermittent or workload‑dependent faults. The advertised five‑minute average is a quick triage pass and not an exhaustive stress test. Problems that appear only under sustained load, high temperatures, or particular memory access patterns may remain undetected. Users should treat a “no issues found” result as useful but not definitive.
  • Noise and unnecessary reboots. Because the initial flight triggers on every bugcheck code, machines that crashed for non‑memory reasons may receive a prompt and schedule an unnecessary pre‑boot scan. That behavior could generate user frustration, support tickets, and a modest increase in reboots attributed to the feature rather than the underlying problem.
  • Ambiguous “mitigated” messaging. Microsoft’s language suggests the OS might “mitigate” memory issues after the diagnostic runs. That term is imprecise: mitigation could mean quarantining bad pages, avoiding allocations, or reporting for hardware replacement. The exact remediation actions and their permanence are not fully documented publicly, so users and administrators should interpret “mitigated” cautiously.
  • Enterprise policy friction. Corporate fleets commonly use BitLocker, Secure Boot policies, and tightened admin controls. The current exclusions and the telemetry used to refine triggers mean the experience will not be universal across managed devices; organizations will need clear guidance and controls to accept, restrict, or audit this behavior in their environments.
  • Telemetry and privacy questions. Microsoft has stated data collection will be used to improve trigger accuracy. While diagnostic telemetry is routine for OS engineering, privacy‑conscious consumers and regulated industries may want explicit controls or opt‑outs to understand what crash data is collected and how it is used.
Where claims or details in public messaging cannot be fully confirmed (for example, the precise remediation steps behind a “mitigated” notification), users should regard those claims as partially unverifiable until Microsoft publishes deeper technical documentation or the feature reaches broader channels. Such unverifiable or vague wording is common in early flights and merits cautious interpretation.

Enterprise implications and policy considerations​

For IT administrators, the feature introduces both opportunity and policy questions.
  • Opportunity: a native, low‑cost triage step simplifies frontline diagnostics and can reduce mean time to resolution for memory‑related incidents. It can also provide reproducible diagnostic evidence tied to the crash event.
  • Policy questions:
  • Should the feature be enabled by default for managed devices, or controlled via Group Policy / MDM?
  • How does the exclusion for BitLocker without Secure Boot interact with existing encryption baselines?
  • Will Administrator Protection or other hardening policies block the prompt in ways that hide the diagnostic from help desk triage?
  • How should organizations handle telemetry from this flow; does it require changes to current telemetry or privacy agreements?
Administrators should test the feature in staged environments before broad deployment, document expected behaviors in standard operating procedures, and confirm how the results surface in existing endpoint management and telemetry consoles.

Practical guidance for end users and technicians​

  • If the memory prompt appears after a legitimate crash, consider scheduling the scan — it is fast and non‑destructive. If the scan finds issues, follow up with extended memory tests and hardware vendor diagnostics.
  • If the prompt appears after a crash you know was caused by something else (for example, a driver update or overheating during gaming), the notification is dismissible — use that option to avoid an unnecessary reboot.
  • If a quick scan reports no errors but crashes continue:
  • Run an extended memory test with the Windows Memory Diagnostic “extended” option or a dedicated tool (such as MemTest86) across multiple passes.
  • Update chipset/BIOS/UEFI and device drivers.
  • Check for thermal issues and power delivery problems, which can cause transient memory faults.
  • For enterprise users, coordinate with IT before accepting the scan. Administrators should decide whether to allow the feature, and if allowed, how to capture or forward diagnostic results to support systems.

A technical deep dive: what the quick scan can and cannot detect​

The Windows Memory Diagnostic performs deterministic tests that attempt to expose certain classes of DRAM faults — stuck bits, address line failures, or pattern‑sensitive errors. The tool is effective at detecting clear hardware defects and some logic‑level failures.
However, it is limited in several ways:
  • It is less likely to reveal faults that only manifest under sustained heavy load, long‑run thermal drift, or specific access patterns generated by particular applications.
  • Modern memory subsystems (with on‑die ECC, multi‑rank configurations, and memory remapping) can mask or relocate errors in ways the pre‑boot quick pass may not fully exercise.
  • Intermittent timing or signal integrity issues caused by the motherboard, DIMM seating, or power circuitry may require longer stress testing and hardware service diagnostics to surface reliably.
Consequently, rely on the quick scan as an early triage tool and follow up with full memory stress tests and hardware vendor diagnostics when problems persist.

What to watch next​

  • Expect Microsoft to refine which bugcheck codes trigger the prompt; the initial “all codes” approach is a data‑collection strategy that will likely be narrowed to reduce noise.
  • Look for expanded platform support (ARM64) and clarified behavior for enterprise scenarios (BitLocker / Secure Boot / Administrator Protection) as the preview advances.
  • Watch for more detailed public documentation from Microsoft describing what “mitigated” means in actionable terms and whether diagnostic logs are made available to users or administrators automatically. Until that documentation appears, the remediation claim should be treated cautiously.

Final assessment​

Proactive Memory Diagnostics is a pragmatic, low‑risk addition to Windows 11’s toolbox that brings a sensible convenience: speeding up basic hardware triage and lowering the barrier for users to verify memory health after a crash. The reliance on the built‑in Windows Memory Diagnostic and the lightweight, optional scheduling model are strengths that minimize disruption and vendor lock‑in.
However, the initial flight’s broad triggering, platform exclusions, and vague “mitigation” language introduce practical limits and potential support overhead. The quick scan does not replace in‑depth memory tests or hardware diagnostics for persistent or intermittent faults, and enterprises will need to evaluate the feature against their security baseline and management policies.
Overall, this is a useful step toward making routine hardware triage more discoverable and standardized on Windows devices. Its real world value will depend on how Microsoft refines triggers, documents remediation semantics, and extends the experience across more hardware and secured configurations in subsequent builds.

Conclusion
A small but meaningful usability and reliability improvement has arrived in Windows Insider builds: Windows 11 can now prompt users to run a quick, scheduled Windows Memory Diagnostic after an unexpected restart, helping catch RAM‑related problems early. The feature is best understood as triage, not replacement for extended testing. Users and administrators should welcome the convenience while remaining aware of the tool’s limits, the current platform exclusions, and the need for further documentation on remediation behavior as the preview evolves.

Source: PCWorld Windows 11 will prompt for memory scans after a crash
 

Microsoft is testing a new Windows 11 feature that will offer a one‑click, post‑crash memory check after a Blue Screen of Death (bugcheck), scheduling the built‑in Windows Memory Diagnostic to run at the next reboot as a quick triage step to detect and surface RAM-related faults.

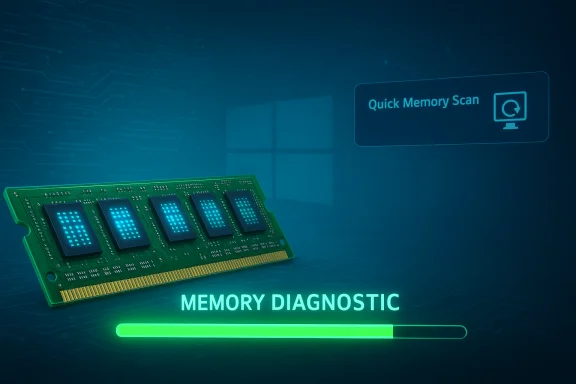
A green RAM module beside a 'Memory Diagnostic' progress bar.Background​

Microsoft introduced the capability in recent Windows Insider Preview builds shipped via the cumulative servicing update identified as KB5067109 (appearing in Dev as Build 26220.6982 and in Beta as Build 26120.6982). The feature, named Proactive Memory Diagnostics, is being piloted to reduce the time between an unexpected kernel crash and a first‑pass hardware triage that can reveal failing DIMMs, memory controller faults, or other memory path problems.
The core idea is simple: after Windows experiences a bugcheck that caused an unexpected restart, the next sign‑in may show a dismissible notification offering to schedule a quick memory scan for the next reboot. If the user accepts, Windows schedules the established Windows Memory Diagnostic tool (mdsched.exe) to run in the pre‑boot environment, perform a rapid default test pass, and then continue booting while reporting results back to the desktop. Microsoft estimates this scheduled triage pass will take about five minutes or less on average on typical systems.

What the feature does — a practical overview​

  • After a bugcheck (a BSOD or kernel‑level unexpected restart), Windows records the crash and reboots.
  • On next sign‑in, Windows may show a notification recommending a “quick memory scan.”
  • If the user opts in, the OS schedules the Windows Memory Diagnostic (mdsched) to run at next restart.
  • The diagnostic runs before the full Windows session loads, performs a short triage pass, and Windows finishes booting.
  • If the diagnostic finds and can apply mitigations, the user receives a follow‑up notification after boot; detailed results are written to Event Viewer under MemoryDiagnostics entries.
This flow is explicitly framed as triage: a fast, low‑friction check intended to catch obvious and reproducible memory faults quickly rather than replace full forensic diagnostics or vendor stress tests. The initial flight is intentionally broad — Microsoft is triggering the prompt for all bugcheck codes while collecting telemetry to refine which crash signatures actually correlate with memory corruption. That telemetry‑driven narrowing is a stated next step to reduce noisy, unnecessary prompts.

Technical details: how the scan runs and what it tests​

The diagnostic used: Windows Memory Diagnostic (mdsched)​

The proactive flow leverages the long‑standing Windows Memory Diagnostic (mdsched.exe). This tool runs outside the full Windows session in a minimal pre‑boot environment and has three primary test modes: Basic, Standard (default mix), and Extended. The Proactive Memory Diagnostics experience schedules a quick/default pass — designed to complete rapidly and catch common, clear memory errors such as persistent cell failures or address line problems. Results are logged to the System log with MemoryDiagnostic entries.

Where results appear and how they can be consumed​

  • Desktop notification after boot will inform users of detected issues or mitigations applied.
  • Administrators and power users can inspect Event Viewer > System for MemoryDiagnostics results to extract details and timestamps for support or RMA workflows.
  • The scheduled diagnostic produces the same kind of log artifacts as an mdsched run invoked manually, making it usable as a diagnostic artifact in support escalations.

Platform and security gating in the early flight​

Microsoft lists several important exclusions for the initial rollout: the prompt is currently not supported on ARM64 devices, on systems with Administrator Protection enabled, and is blocked when BitLocker is active without Secure Boot. These exclusions are consequential for both consumers and enterprise fleets and reflect pre‑boot and boot security interactions with disk encryption and secure boot flows. The company is also rolling this out via staged, server‑side toggles, so not every Insider will necessarily see the feature immediately even after installing the relevant update.

Why Microsoft is adding this: intended benefits​

Memory corruption is a common but often hidden cause of random crashes, application corruption, and repeated instability. The new prompt aims to deliver several practical benefits:
  • Faster triage: A one‑click path to a built‑in memory check reduces the need for users or techs to remember mdsched or hunt for third‑party diagnostics.
  • Reduced downtime: Catching failing RAM early can stop crash loops and prevent data corruption or repeated support cycles.
  • Standardized evidence: Because the built‑in diagnostic writes system logs, it simplifies RMA and warranty workflows where vendor evidence is required.
  • Low friction and consent driven: The scan is opt‑in, scheduled to the next reboot, and positioned as a short triage pass — balancing usefulness with minimal interruption.
These are pragmatic, incremental improvements that, for many end users and smaller support operations, can measurably shorten the path to identifying common hardware causes of instability.

Caveats, limitations, and risk profile​

Short scans are not exhaustive​

The advertised ~five‑minute runtime reflects a brief triage pass, not a comprehensive stress or forensic test. Intermittent errors, thermal‑dependent failures, or faults that appear only under heavy sustained load may not be detected in a quick pre‑boot pass. A “no issues found” message therefore should be treated as useful but not definitive. Extended tests (the Extended mdsched mode) or vendor stress tools may still be required when intermittent symptoms persist.

Noise and false positives during the telemetry collection phase​

Because Microsoft is temporarily triggering the prompt for all bugcheck codes to gather telemetry, there is a meaningful risk of noisy prompts. Crashes caused by driver bugs, firmware glitches, or overheating could cause the diagnostic prompt to appear even when RAM is not at fault. That noise can create user confusion, extra reboots, and a temporary uptick in support tickets until triggers are refined. Administrators running critical workloads should be aware of this risk during pilot deployments.

Ambiguous wording around “mitigation”​

Microsoft’s messaging that the diagnostic may “mitigate” issues needs clarification. In practice, the OS can sometimes avoid allocating flagged bad pages or report errors that lead to deeper remediation steps, but the diagnostic itself does not physically repair hardware. Treat any “mitigated” status as an indication the system observed a problem and avoided the failing region, not as a permanent fix for a defective DIMM. This distinction matters for warranty and replacement decisions.

Platform and enterprise exclusions matter​

The early exclusions (ARM64, Administrator Protection, BitLocker without Secure Boot) leave many modern, secure, or enterprise devices out of the immediate benefit. Administrators should validate the behavior against their fleet profiles before relying on it as a first‑line triage tool in production.

Telemetry and privacy considerations​

Public release notes do not fully enumerate the telemetry the feature collects while Microsoft refines triggers. Enterprises and privacy‑conscious users should treat telemetry claims as unverified until Microsoft provides a detailed telemetry/privacy breakdown for the proactive diagnostic flow. Organizations may choose to block or pilot the feature behind policy until telemetry handling is clarified.

What this means for different audiences​

Home users and enthusiasts​

  • Benefit: A fast, built‑in way to check RAM after a scary BSOD without creating bootable media or downloading tools.
  • Caveat: A quick pass might not catch intermittent faults; follow up with longer tests if issues persist.
  • Action: If offered the prompt and you have time for a short reboot, accept it — it’s a low‑cost check that can save hours of troubleshooting later.

IT help desks and support teams​

  • Benefit: Standardized diagnostic artifacts in Event Viewer simplify triage and RMA paths.
  • Caveat: Expect noise during early flights; plan to collect telemetry on prompt frequency and false positives to inform acceptance policies.
  • Action: Pilot the feature on representative test devices first, exclude ARM64 fleets if necessary, and prepare playbooks to escalate to vendor diagnostics when short scans are inconclusive.

Enterprises and device managers​

  • Benefit: Potential to reduce time to root cause for hardware‑related incidents.
  • Caveat: Exclusions and telemetry uncertainty mean this should not be treated as authoritative in its initial state.
  • Action: Use Group Policy or Intune policy to control Insider enrollments and testing; monitor Microsoft’s documentation for policy controls that may allow administrators to opt devices out until triggers are refined.

How to interpret and act on results​

  • If the diagnostic reports errors:
  • Review Event Viewer > System for MemoryDiagnostics‑Results.
  • Cross‑check with vendor memory test utilities and run extended tests (Extended mdsched or vendor tools).
  • Document logs and timestamps for warranty/RMA claims.
  • If the diagnostic reports no issues found:
  • Consider running a longer Extended test or vendor stress tool if crashes continue.
  • Inspect other causes: drivers, firmware/BIOS updates, thermal throttling, and storage corruption.
  • If the diagnostic behavior or prompts become noisy:
  • Record frequency and bugcheck codes triggering prompts and provide feedback through Insider channels to help Microsoft refine triggers.

Recommended pilot checklist for IT teams​

  • Identify a representative set of test devices that mirror your fleet’s x86/x64 hardware; exclude ARM64 devices to ensure the feature is present for testing.
  • Enroll these devices in the Windows Insider program (Dev or Beta channel) and install the relevant servicing update (KB5067109) to obtain the builds shipping the feature.
  • Reproduce crash scenarios in a controlled lab when safe, or monitor naturally occurring bugchecks while measuring prompt frequency and the percentage of scans that find memory issues.
  • Validate integration with enterprise imaging, BitLocker, and Secure Boot policies to confirm the prompt behaves consistently in managed configurations.
  • Prepare escalation steps to vendor diagnostic suites for any diagnostic artifacts that indicate persistent faults.

Practical advice for everyday users​

  • When you see the sign‑in notification offering a quick memory scan after a crash, accepting is usually a sensible first step if you can spare a short reboot.
  • If you rely on critical services or have unsaved work, schedule the scan for a maintenance window — the scan is opt‑in and scheduled for the next reboot rather than forcing an immediate interruption.
  • If the scan finds nothing but problems continue, run Extended memory tests or vendor tools and check for driver/firmware updates. Do not assume a clean short scan rules out memory issues entirely.

Analysis: strengths, tradeoffs, and long‑term implications​

Notable strengths​

  • Low friction and discoverability: Integrating basic hardware triage into the sign‑in flow lowers the barrier to action for non‑technical users and reduces reliance on third‑party tools.
  • Evidence generation: Automatic logging of results into Event Viewer creates consistent artifacts useful for support, vendor RMA, and warranty claims.
  • Data‑driven refinement: Microsoft’s telemetry approach — broad initial triggers followed by refinement — is sensible for engineering but requires clear communication to manage expectations and noise.

Potential risks and tradeoffs​

  • User disruption and support churn: If prompts are too frequent or misaligned with the root cause, users can become frustrated and support teams will see increased ticket volume.
  • Incomplete diagnostics: Short triage passes can provide false reassurance; vendors and admins must continue to rely on deeper tests for definitive results.
  • Telemetry and privacy: Without full transparency on telemetry, organizations should be cautious when enabling the feature fleet‑wide.

Long‑term implications​

If Microsoft successfully sharpens which bugcheck signatures correlate with memory corruption, the proactive flow could become a powerful reliability tool that prevents repeated crashes and reduces wasted support cycles. Conversely, if triggers remain noisy or telemetry remains opaque, adoption in enterprise settings will be slow and the feature could be relegated to a convenience for home users rather than a broadly useful IT tool. The success of this experiment hinges on balancing sensitivity (catching real memory faults) with specificity (avoiding prompts for unrelated failures).

Quick reference: what to watch for in future releases​

  • Whether Microsoft narrows the initial “trigger on all bugcheck codes” approach to a targeted set of crash signatures.
  • Updates on telemetry collection and privacy disclosures specific to Proactive Memory Diagnostics.
  • Expansion of platform support (ARM64) and adjustments to Administrator Protection/BitLocker gating.
  • Introduction of management controls (Group Policy / Intune) to allow enterprises to opt devices in or out of the experience.

Conclusion​

Proactive Memory Diagnostics is a pragmatic, user‑centric feature that applies an existing, trusted diagnostic (Windows Memory Diagnostic) in a new, contextually relevant way: right after a kernel crash. For many users, the change will reduce friction and accelerate the detection of clear RAM faults. For IT teams, it promises a standardized artifact to aid triage — provided Microsoft refines triggers and clarifies telemetry handling.
The feature is not a silver bullet. Short pre‑boot scans cannot replace extended stress tests or vendor diagnostics for intermittent or workload‑specific faults. Early adopters should pilot carefully, collect data on prompt accuracy, and treat results as the start of an evidence chain rather than the final verdict. If Microsoft balances sensitivity with specificity and gives admins clear controls, this small UX change could make a measurable difference in day‑to‑day reliability for Windows 11 users.

Source: [H]ard|Forum https://hardforum.com/threads/windo...s-after-bsod-to-prevent-future-issues.2044339
 

Microsoft is testing a new, consent-driven post‑crash diagnostic in Windows 11 that will offer users a one‑click way to schedule a quick RAM check after a Blue Screen or unexpected restart — scheduling the built‑in Windows Memory Diagnostic to run at the next reboot and report back if errors or mitigations are detected.

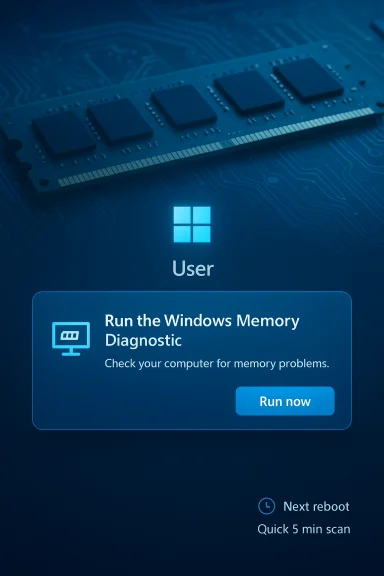
Windows user login screen showing a 'Run the Windows Memory Diagnostic' prompt on a blue RAM-themed background.Background​

Microsoft introduced this experiment as part of recent Windows Insider preview updates distributed under KB5067109. The change appears in Dev‑channel builds as Build 26220.6982 and in Beta‑channel builds as Build 26120.6982, with the public write‑up published on the Windows Insider blog.
The feature — named in Microsoft’s notes as Proactive Memory Diagnostics — aims to reduce the time between a kernel bugcheck and basic hardware triage by surfacing a sign‑in notification after an unexpected restart. If the user agrees, Windows schedules a pre‑boot Windows Memory Diagnostic (mdsched.exe) run for the next restart. Microsoft characterizes the scheduled pass as a short triage step, “taking 5 minutes or less on average.”
This is an early, controlled flight: Microsoft intentionally triggers the prompt for all bugcheck codes during telemetry collection, and the experience is gated on several platform and security conditions in the preview.

What this actually does — step by step​

1. Crash detection and sign‑in notification​

After Windows detects a bugcheck (an unexpected restart often visible as a BSOD/GSOD/black screen), the system records the crash and reboots. On the next sign‑in a dismissible notification may appear suggesting a quick memory scan.

2. User consent and scheduling​

If the user accepts, Windows schedules the built‑in Windows Memory Diagnostic to run during the next restart in the pre‑boot environment. This scheduling is opt‑in — the prompt is dismissible and no scan runs without explicit consent.

3. Pre‑boot scan and resume​

On the subsequent reboot the Windows Memory Diagnostic runs before the full OS loads, performs a short default pass (the quick triage), and then resumes booting into Windows. Microsoft’s initial guidance estimates the quick scan will take around five minutes on average, although actual runtime depends on configured test depth and installed RAM.

4. Notification and evidence​

If the diagnostic finds and applies mitigations, Windows will deliver a follow‑up notification after boot. The underlying test writes results to Event Viewer (look for MemoryDiagnostics entries), giving technicians a forensic artifact to use for warranty claims or further triage.

Why Microsoft is doing this​

Memory corruption — whether from defective DIMMs, flaky memory controllers, incompatible firmware, or unstable overclocking/XMP settings — is a common but often invisible root cause of crashes, freezes, and data corruption. Historically, running a memory test has required manual action: launching the Windows Memory Diagnostic (mdsched), scheduling it for the next reboot, or booting a third‑party tool such as MemTest86 from USB. Automating the triage prompt immediately after a crash reduces friction for non‑technical users and can accelerate identification of hardware faults before they cause repeated downtime or corrupted files.
For enterprises and support desks, this could mean faster, more consistent evidence collection for RMAs and quicker first‑line diagnosis — if the feature is adopted within managed policies and piloted carefully.

Technical details and constraints​

The diagnostic used​

The feature leverages the long‑standing Windows Memory Diagnostic (mdsched.exe) utility — the same pre‑boot tester used by administrators for years. That tool offers Basic, Standard and Extended test mixes; Microsoft’s proactive flow schedules a quick/default pass intended to be short.

Where results are logged​

Results from a Windows Memory Diagnostic run are normally recorded in Event Viewer under Applications and Services Logs → Microsoft → Windows → MemoryDiagnostics‑Results or visible in the System log as MemoryDiagnostic events. Administrators can parse these logs programmatically (PowerShell Get‑WinEvent) for automated ticketing.

Timing considerations​

Microsoft’s “five minutes or less on average” is a practical estimate for the quick triage pass, not a guarantee. Actual test time depends on:
  • Amount of installed RAM
  • The chosen test mix (Basic/Standard/Extended)
  • CPU and platform performance
  • Number of passes configured
A short default pass is plausible for modest RAM sizes, but extended diagnostics still require substantially more time; power users and technicians should not treat a quick negative as definitive.

Platform and security exclusions​

In the current Insider flight Microsoft has explicitly restricted the experience. The prompt is not available on:
  • ARM64 (Windows on ARM) devices
  • Systems with Administrator Protection enabled
  • Devices using BitLocker where Secure Boot is not enabled
These exclusions reflect the pre‑boot nature of the test and interactions with boot security/encryption and endpoint protections.

Which Insider builds include it​

The capability is shipped as part of cumulative update KB5067109, appearing as Build 26220.6982 (Dev) and Build 26120.6982 (Beta) in the Insider program; Microsoft is rolling features gradually via server‑side toggles.

Practical benefits for everyday users​

  • Lower barrier to triage: Non‑technical users are far more likely to run a test when it is presented as a single, integrated action.
  • Faster warranty evidence: Early detection increases the chances of documenting faulty RAM before it causes further damage, easing RMA claims.
  • Fewer sketchy downloads: A native option discourages users from searching for third‑party RAM testers — some of which can be outdated or bundled with unwanted software.
  • Minimal downtime (in many cases): The quick pass aims to finish in minutes and resume the boot process, reducing disruption compared with longer manual tests.

Limitations, risks and what Microsoft hasn’t fully specified​

This is triage, not a silver bullet​

The experience is explicitly framed as a first pass — a rapid triage that may catch obvious hardware failures but will not replace full forensic memory validation. Intermittent faults, thermal or stress‑related failures, and subtle timing issues can escape a short scan and require multi‑pass Extended tests or MemTest86 cycles.

“Mitigate” is ambiguous​

Microsoft’s blog says the diagnostic “may find and mitigate” issues, but the company has not published a machine‑readable specification of what mitigation entails in each failure class. In practice, typical mitigations might include blacklisting bad pages from allocation or advising a replacement; they do not repair physical faults. This lack of specificity should be treated as an unverifiable claim until Microsoft documents the exact remediation logic.

Over‑triggering and noise​

Because the initial flight triggers on all bugcheck codes to collect telemetry, many prompts will be false positives for memory‑related causes. Enterprises may see additional helpdesk volume if users treat the quick scan as definitive rather than a first step. Microsoft intends to refine triggers based on telemetry, but early adopters should expect some noise.

Coverage gaps in managed fleets​

Platform exclusions (ARM64, Administrator Protection, BitLocker without Secure Boot) mean many managed endpoints — especially those hardened with security features — won’t see the prompt. IT organizations should not rely solely on this feature for fleet health checks; continue to maintain manual diagnostic flows and vendor test kits.

Event logging and result visibility​

Some users have historically reported difficulty finding or interpreting Windows Memory Diagnostic results in Event Viewer. If the proactive flow is relied upon for RMA evidence, organizations should validate the exact log artifacts produced by the scheduled run and ensure helpdesk tooling parses the correct event source. Microsoft and third‑party documentation provide guidance for locating these logs, but the behavior may vary across Windows builds and configurations.

Guidance for IT teams and enthusiasts​

  • Pilot before broad rollout:
  • Identify a representative set of test machines (x86/x64 profiles).
  • Validate behavior under your typical boot security and BitLocker policies.
  • Confirm how Event Viewer logs appear and whether they integrate with your ticketing/telemetry pipeline.
  • Treat results as triage:
  • A single quick pass is a helpful signal, not definitive proof.
  • For positive findings, follow with extended tests, per‑module isolation, or vendor diagnostic tools before issuing replacement orders.
  • Update runbooks and automation:
  • Add parsing of MemoryDiagnostics events.
  • Correlate minidump stop codes with memory failures before escalating to hardware RMA.
  • Document privacy and telemetry posture:
  • Microsoft’s early telemetry collection will be broad; review diagnostic data settings and audit what is uploaded if your organization has strict telemetry policies.
  • Communicate to end users:
  • Explain the prompt, emphasize opt‑in behavior, and provide simple guidance: accept the scan when convenient, then report results if they indicate hardware faults.

How this changes everyday troubleshooting​

For home users and small support teams, the new flow converts an often‑ignored but critical test into a contextual prompt: you crash, you sign in, and Windows offers a quick diagnostic step. That changes the default user behavior for the better — more scans, more evidence, faster identification of bad RAM.
For technicians, it adds another artifact to the triage stack: an Event Viewer entry produced close to the crash timeline that can be correlated with minidumps and firmware logs to find root causes faster. For enterprises, the impact will depend on how Microsoft exposes policy controls (Group Policy, MDM) and whether the company narrows triggers to high‑signal stop codes before wide release.

What to watch next​

  • Microsoft’s refinement of trigger rules: narrowing prompts to specific bugcheck signatures that most strongly correlate with memory corruption.
  • Formal documentation of what “mitigate” means and whether the OS applies any persistent changes after detection.
  • Expansion of support to ARM64 and clarifications on Administrator Protection and BitLocker interplay.
  • Enterprise controls: Group Policy or MDM settings to allow, block, or customize the proactive memory diagnostics experience across managed fleets.

Final assessment​

Proactive Memory Diagnostics is a practical, low‑friction reliability feature that addresses an old Windows pain point with a sensible, opt‑in approach. It leverages existing, trusted tooling (the Windows Memory Diagnostic) and improves discoverability for a critical hardware test. For average users it will likely reduce the time to detect failing RAM and discourage unsafe third‑party downloads. For IT teams it offers a new signal for triage — provided they pilot and validate the experience against vendor diagnostics.
That said, the feature’s current telemetry‑first rollout and platform exclusions introduce noise and coverage gaps. The promise that Windows will “mitigate” memory issues is useful but currently imprecise; organizations should demand clearer documentation and enterprise policy controls before adopting the feature as a formal step in support playbooks. Until triggers are refined and mitigation behavior is transparent, treat results as triage evidence to be followed by vendor‑grade verification.

Accept the scan when convenient, use the Event Viewer MemoryDiagnostics entries to capture evidence, and follow up with Extended tests or MemTest86 when the quick pass indicates problems or crashes persist — this combination preserves speed without sacrificing diagnostic rigor.

Source: PCMag Australia Windows 11 Will Soon Offer Memory Scans After a Blue Screen of Death
 

Back
Top