
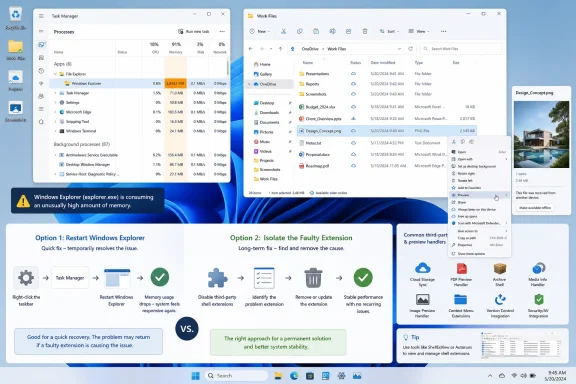
explorer.exe sits at the center of the Windows shell and can retain memory when a component, extension, preview handler, or Windows bug goes wrong. Recent reporting highlights reports of Explorer usage rising far beyond a normal working level, including one case exceeding 21GB, while noting that even a sustained 2GB footprint can be punishing on systems with modest memory capacity. BGRThe important distinction is that high memory usage is not automatically a memory leak. Explorer may legitimately use more memory while rendering thumbnails, enumerating a massive directory, displaying cloud-backed content, preparing previews, or hosting context-menu integrations. A leak is different: it describes memory that continues to be allocated and is not released when the operation that required it has finished. Microsoft’s debugging guidance warns that, as available memory is depleted over time, Windows can slow down and eventually become unstable. Microsoft Learn
For Windows 11 users, the result can be especially confusing. The process listed as Windows Explorer in Task Manager is not merely the window used to browse Documents or Downloads. It is also deeply involved in the desktop, taskbar, Start-adjacent shell experience, notification area, File Explorer windows, and many of the third-party features woven into Windows’ right-click menus and file views. Restarting it can provide immediate relief, but identifying why the memory climbs is the difference between a quick workaround and a durable fix.
 Why Explorer’s Memory Use Matters
Windows is designed to use RAM actively. Empty memory does not make a system faster; unused RAM may be employed for caching, background services, and applications that Windows expects a user to revisit. That means a single Task Manager number, observed once, should not trigger panic.
The warning sign is growth without recovery. If explorer.exe begins at a relatively restrained level after sign-in, then climbs every time folders are opened, files are previewed, cloud locations are browsed, or the desktop is refreshed—and never drops substantially—the pattern deserves investigation.
A machine with 32GB or 64GB of RAM may tolerate an Explorer problem for longer than a low-memory laptop. But capacity does not make the behavior healthy. Once Explorer has committed enough memory to pressure the rest of the system, Windows can spend more time compressing memory or paging data to storage, producing slow app switching, delayed clicks, frozen taskbar interactions, and File Explorer windows that appear to stop responding.
The practical effect can be disproportionate because Explorer is a shell process. A memory-hungry web browser tab is inconvenient; an unstable shell can affect the basic act of opening files, using the desktop, invoking the Start menu, or right-clicking an item.
The 2GB number is a warning, not a universal threshold
It is tempting to treat a particular figure—500MB, 1GB, or 2GB—as a hard failure line. It is not. Explorer’s expected memory use varies with the Windows build, session uptime, number of open windows, folder contents, image and video previews, connected storage, installed software, and other active shell features.
What matters more is the trend:
- Does Explorer’s memory fall after closing demanding windows?
- Does it increase predictably after a repeatable action?
- Does it climb while the PC is idle?
- Does restarting Explorer reset the number, only for it to steadily rise again?
- Does the problem disappear after a clean boot or after removing a particular integration?
A growing baseline after repeated identical tasks is stronger evidence than one unusually high snapshot.
Explorer Is More Than the File Manager
Microsoft describes File Explorer as the built-in interface for finding, opening, organizing, and managing files both locally and in the cloud. In Windows 11, its Home view can also surface recent and favorite Office.com content, while Quick access and pinned known folders add more locations for Explorer to process at launch. Microsoft Support
That broader role matters because every additional integration introduces potential work:
- File metadata must be queried and displayed.
- Thumbnails and preview handlers may inspect file contents.
- Search and indexing components can interact with folder activity.
- Cloud storage providers may update status indicators or placeholders.
- Antivirus products may scan selected items.
- Archivers, source-control tools, media utilities, backup applications, and graphics suites may add right-click commands.
- Network shares and removable drives can be queried or become unavailable mid-operation.
None of those features automatically indicates a defect. They explain, however, why a problem that appears to be “File Explorer using too much memory” may originate outside the core File Explorer code.
The shell-extension risk is real
Windows supports shell extensions—components that add functionality to Explorer and other shell surfaces. Microsoft notes that shell extension handlers are in-process COM DLLs loaded directly into the Explorer process, meaning a crash or hang in an extension can crash or hang Explorer itself. Microsoft Learn
That architectural reality is central to diagnosing persistent Explorer trouble. If a third-party DLL runs inside explorer.exe, Task Manager may show Explorer accumulating memory even though the underlying defect belongs to a compression tool, cloud-sync client, image codec, document-preview utility, security suite, or context-menu enhancement.
Microsoft’s current developer documentation makes the performance expectation explicit for File Explorer context-menu commands: extensions should keep menu-construction work fast and avoid expensive processing on the File Explorer user-interface path. Microsoft Learn When that guidance is ignored—or when an otherwise sound integration encounters an edge case—the user sees the consequence in Explorer.
What a Memory Leak Actually Looks Like
A memory leak occurs when a process allocates memory but fails to free it after it is no longer required. Microsoft’s diagnostic documentation recommends confirming a leak by monitoring behavior over time rather than relying on a single observation. Microsoft Learn
In simple terms, a genuine Explorer leak often follows this cycle:
- Sign in or restart Explorer.
- Memory usage begins at a reasonable baseline.
- Open or browse a particular kind of folder, file type, network location, or cloud location.
- Explorer memory grows.
- Close the window or stop the action.
- Memory remains elevated rather than returning toward the earlier baseline.
- Repeat the action and the number climbs further.
That behavior is different from temporary working-set growth. A folder packed with high-resolution photographs or video files may cause Explorer to load thumbnails and metadata. RAM may spike while Explorer is doing work, then remain somewhat elevated because Windows retains cacheable information. A temporary rise can be normal; repeated, unbounded accumulation is not.
Task Manager does not tell the entire story
Task Manager is useful for spotting the issue, but its memory column is a starting point rather than a full diagnosis. Different tools describe memory through different measurements: working set, committed memory, private bytes, virtual memory, and other categories. Comparing unlike figures can produce misleading conclusions.
Microsoft’s Sysinternals PsList documentation distinguishes, among other values, a process’s working set and private virtual memory. Microsoft Learn For deeper inspection, Microsoft’s Process Explorer can show the DLLs and memory-mapped files loaded by a selected process, making it useful when Explorer is suspected of carrying a problematic add-on. Microsoft Learn
The key is consistency. If testing in Task Manager, use Task Manager for each observation. If testing in Process Explorer, remain in Process Explorer. Record the same measurement at the same points in the workflow.
The Fastest Fix: Restart Windows Explorer
When Explorer’s memory consumption has already become disruptive, restarting the process is the fastest practical response. This does not repair the cause, but it ends the current Explorer session and starts a new one, releasing memory held by the old process.
Microsoft itself documents restarting Windows Explorer through Task Manager as a recovery step when dealing with a blank-screen scenario. The official sequence is to open Task Manager with Ctrl + Shift + Esc, locate Windows Explorer, right-click it, and select Restart. If Explorer is absent, Windows can be instructed to start it again through File > Run new task followed by explorer.exe. Microsoft Support
What restarting Explorer does—and does not—do
Restarting Explorer will usually:
- Close open File Explorer windows.
- Reload the desktop, taskbar, and notification area.
- Clear the current
explorer.exeprocess and its immediate memory allocation. - Restore responsiveness if the shell has become bogged down.
It will not necessarily:
- Fix damaged Windows system files.
- Remove a flawed third-party shell extension.
- Repair a problematic network share.
- Correct an application that reinjects itself into Explorer.
- Prevent the leak from returning after the same trigger occurs.
Think of it as rebooting the cockpit, not repairing the engine. It is highly effective as symptom control, especially when the PC must immediately become usable, but recurring cases require a more methodical approach.
First-Line Troubleshooting: Updates and a Full Restart
The first durable action should be to install pending Windows updates and restart the PC. Microsoft’s File Explorer support guidance specifically recommends checking for updates through Settings > Windows Update > Check for updates, installing what is available, and restarting if required. Microsoft Support
That recommendation is not a vague ritual. File Explorer is part of Windows, and cumulative updates can address shell defects, stability problems, compatibility regressions, and security issues. A restart also ensures that pending components are fully installed and that the existing Explorer process is not simply continuing a days-old, degraded session.
A sensible update routine
- Save active work and close important applications.
- Open Settings.
- Navigate to Windows Update.
- Select Check for updates.
- Install all applicable updates.
- Restart even if Windows does not strongly prompt for one.
- Test Explorer before reinstalling utilities or changing system settings.
The disciplined part is the final step: test after updating but before introducing several other changes. If Explorer remains stable, there is no need to create a more complicated troubleshooting trail.
Identify the Trigger Before Blaming Windows
A high Explorer memory number often tells only half the story. The more useful question is: What was Explorer doing immediately before its memory started climbing?
Create a brief, repeatable test. Restart Explorer, note the initial value, then perform one activity at a time. Avoid opening every familiar folder at once, because that obscures the trigger.
Common triggers worth testing
- A folder with thousands of files.
- A directory containing raw photos, high-resolution images, or video.
- A network share or NAS location.
- A removable USB drive or SD card.
- A OneDrive or other cloud-synced folder.
- The Downloads folder, particularly if it holds many mixed file types.
- Folder previews or the Preview pane.
- Repeated right-clicking of files that expose extensive third-party context menus.
- Searching within a large folder.
- Browsing folders containing archives, engineering files, media projects, or virtual-machine images.
If the rise happens only in one location, the issue may be tied to that folder’s contents, its metadata, its sync provider, or an extension invoked for a particular file type. If the rise happens simply while the computer sits idle, the investigation should widen to background utilities, shell add-ons, system services, and potentially Windows itself.
Thumbnail and preview pressure is not the same as a leak
File Explorer can generate thumbnails and previews for image, video, document, and other supported file formats. This is convenient, but it requires additional work compared with a plain list of file names.
As a diagnostic experiment—not necessarily a permanent preference—switch the affected folder to a simpler view, close the Preview pane, and test whether memory growth changes. If Explorer remains stable without thumbnails or previews, focus on the codecs, preview handlers, file types, or content within the problematic directory.
That finding does not prove Windows is faultless. It does, however, sharply narrow the problem from “Explorer uses too much RAM” to “a resource-intensive file-rendering path may be retaining memory.”
Third-Party Extensions Are a Prime Suspect
Because extensions operate inside the Explorer process, they should be high on the list whenever the issue began after installing or updating software that interacts with files.
Potential sources include:
- Cloud-storage clients that display sync overlays.
- Antivirus and endpoint-security products.
- Archive managers and file compression tools.
- Git, SVN, and developer workflow clients.
- PDF, image, video, or 3D preview utilities.
- Media-library tools.
- File tagging and metadata applications.
- Desktop customization tools.
- Legacy right-click menu utilities.
Microsoft’s own shell-extension guidance emphasizes that these handlers run in-process and can destabilize Explorer. Microsoft Learn This is why merely seeing explorer.exe at the top of a memory list is not enough to assign blame conclusively to Windows.
Use a clean boot to isolate background conflicts
A clean boot starts Windows using essential drivers and startup programs while reducing interference from non-Microsoft background software. Microsoft describes it as a way to troubleshoot conflicts affecting applications and games, with more control than Safe Mode for isolating a cause. Microsoft Support
The clean-boot method is especially valuable when Explorer behaves normally immediately after restarting but begins leaking only after several background tools load. Microsoft’s documented process includes using msconfig, hiding Microsoft services before disabling the remaining services, disabling startup applications in Task Manager, and then restarting into the clean environment. Microsoft Support
If the memory-growth pattern disappears in that state, re-enable services and startup items systematically rather than all at once. Microsoft recommends narrowing the cause by enabling subsets of items, restarting, and observing whether the problem returns. Microsoft Support
This method has two strengths:
- It replaces guesswork with a controlled comparison.
- It avoids the risky habit of uninstalling random applications without evidence.
The risk is temporary loss of functionality. VPN tools, printer helpers, audio utilities, cloud sync, security-related features, and peripheral software may not operate normally in a clean boot. Keep a record of every disabled item and restore normal startup once the test is complete.
Repair Windows Only When the Evidence Points There
If Explorer’s memory issue persists across a clean boot, recurs after Windows updates, affects ordinary folders rather than a single file type or service, and is accompanied by broader shell instability, it becomes reasonable to check Windows component integrity.
Microsoft recommends running Deployment Image Servicing and Management before System File Checker when repairing damaged or missing system files. The supported commands, run from an elevated Command Prompt or Terminal, are:
DISM.exe /Online /Cleanup-image /Restorehealth
sfc /scannow
Microsoft explains that DISM can obtain files needed to repair corrupted Windows components, while sfc /scannow scans protected system files and replaces damaged files with cached copies where possible. Microsoft Support
Why this is useful—but not magic
These tools are appropriate when Windows components may have been corrupted. They are not a universal fix for every high-memory process.
If the actual fault is a third-party context-menu DLL, an unstable cloud-storage integration, a troublesome media preview handler, or a particular remote location, DISM and SFC may report no issues—and that would be entirely consistent with the problem. The commands validate Windows’ protected system files, not every piece of software loaded into the shell.
Run them when the symptom profile suggests a system-level issue, especially if Explorer also crashes, fails to start, shows corrupted interface behavior, or exhibits trouble alongside other Windows components.
Use Better Tools When the Problem Keeps Returning
For an occasional spike, Task Manager and an Explorer restart are enough. For a pattern that returns weekly, daily, or after a particular workflow, use more precise diagnostics.
Microsoft’s Process Explorer displays active processes and can reveal the handles, DLLs, and memory-mapped files loaded by a selected process. Microsoft Learn That makes it especially relevant when a user suspects that a shell extension or injected DLL is connected to Explorer’s memory growth.
A practical evidence-gathering checklist
Before making major changes, collect:
- The Windows version and update level.
- The memory figure immediately after an Explorer restart.
- The memory figure after 10, 30, and 60 minutes.
- The action that preceded each increase.
- Whether open Explorer windows were closed before rechecking.
- Whether a specific directory, file type, drive, or cloud location was involved.
- Installed or recently updated file-management, cloud, archive, security, and customization tools.
- Whether a clean boot changes the result.
- Whether restarting Explorer instantly returns memory to baseline.
This is not bureaucratic overhead. It helps distinguish an operating-system leak from a user-mode extension problem, and it creates a reliable record if the problem eventually needs to be escalated to Microsoft, a PC maker, or a software vendor.
Be careful with “RAM cleaner” utilities
Memory-cleaning applications are frequently marketed as a cure for high RAM usage. They are rarely an appropriate fix for a recurring Explorer memory leak.
A cleaner may temporarily force memory trimming, but it does not correct the code path that keeps allocating memory. In some cases, aggressively emptying working sets can even degrade performance by causing applications to reload data they would otherwise retain efficiently. Restarting Explorer, updating Windows, identifying extensions, and reproducing the trigger are more meaningful corrective actions.
When High Explorer Memory Is an Urgent Problem
Treat the situation as more than cosmetic when one or more of these conditions occurs:
- Explorer climbs steadily into gigabytes and keeps growing.
- The system becomes slow despite little activity in visible applications.
- The desktop, taskbar, Start menu, or right-click menus freeze or repeatedly reset.
- Explorer crashes or restarts on its own.
- The issue is consistently triggered by a common workflow.
- It began immediately after a Windows update, driver update, or application installation.
- The PC has limited RAM and becomes unusable before a normal work session ends.
Microsoft’s File Explorer troubleshooting guidance includes updates and a restart as initial measures when Explorer will not start or function properly. Microsoft Support Escalate beyond those basics when the issue is reproducible and the basic measures do not hold.
The most constructive escalation report includes the trigger, the before-and-after memory readings, the Windows build, relevant software changes, and whether the problem occurs in a clean boot. “Explorer uses 2GB” is a useful symptom; “Explorer’s private memory rises by roughly 150MB every time a folder of videos is opened, persists after the folder closes, and disappears in a clean boot” is actionable diagnostic evidence.
The Bottom Line
Windows Explorer uses memory because it is not just a window for browsing files; it is a core part of the Windows shell that coordinates file views, previews, metadata, cloud locations, desktop behavior, and a large ecosystem of extensions. Some memory growth during demanding file operations is expected. Persistent growth that does not recede is the real problem.
For immediate relief, restart Windows Explorer from Task Manager. For a recurring issue, install Windows updates, observe the precise trigger, test thumbnails and previews, isolate third-party startup software through a clean boot, and use Process Explorer when the evidence points to extensions loaded into explorer.exe. If symptoms suggest broader Windows corruption, run DISM followed by SFC using Microsoft’s supported procedure.
That approach avoids two bad extremes: dismissing every high-memory reading as normal caching, and blaming Windows before checking the third-party components that share Explorer’s process. In a system as extensible as Windows 11, the fastest path to a stable File Explorer is usually disciplined isolation—not a one-click memory “fix.”
