
For RTX 50 owners, the practical change is substantial. A conventional “GPU Temperature” reading can tell a reassuring story—perhaps high 60s or 70s Celsius—while a much smaller area of the silicon is far hotter and may be reaching a protection threshold. The newly available hotspot figure does not automatically mean that every RTX 50 card has a defect. It does, however, make it far easier to distinguish a healthy card from one suffering poor cooler contact, uneven thermal-interface material, mounting pressure problems, or an airflow limitation that average-temperature monitoring alone could conceal.
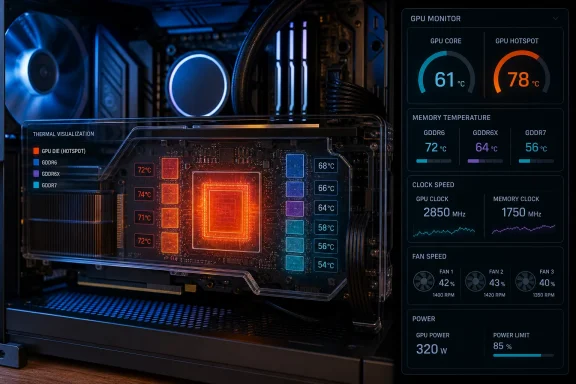
The parallel breakthrough in per-chip VRAM temperature monitoring is arguably even more interesting for enthusiasts. Instead of relying on a single memory temperature that may represent the hottest available location, users can now inspect thermal data for individual GDDR6, GDDR6X, and GDDR7 memory devices in supported configurations. That turns vague suspicion—“the memory may be running hot”—into a specific diagnosis: which chip is warmer, by how much, and whether the cooler or thermal-pad arrangement is treating the memory array evenly.
 Background: Why GPU Hotspot Temperature Matters
Modern graphics processors do not run at one perfectly uniform temperature. A GPU die contains many functional regions, and heat density varies with workload, voltage, clock behavior, physical contact with the cooler, and the distribution of thermal interface material. The standard GPU temperature exposed in Windows hardware utilities is useful, but it is typically a generalized or averaged figure. It cannot always represent the hottest localized region of the die.
That is where GPU hotspot temperature becomes valuable. The metric identifies the hottest monitored point on the graphics processor, offering a more demanding measure of cooling quality than the conventional core temperature alone. A large gap between the average GPU temperature and hotspot temperature can be an early clue that the cold plate is not making even contact, thermal paste coverage is poor, a mounting system is exerting uneven pressure, or a card is behaving differently under sustained load than it does during a short benchmark run.
This is not simply a metric for extreme overclockers. It has everyday diagnostic value. A user may see high fan noise, inconsistent performance, falling boost clocks, stutter during long gaming sessions, or crashes that only occur under heavy GPU load. If the average temperature stays within an apparently reasonable range, the obvious troubleshooting paths—cleaning dust filters, adding case fans, or adjusting a fan curve—may not explain the issue. Hotspot data provides the missing context.
The RTX 50 series created an unusual visibility problem because the sensor hardware apparently remained present while public monitoring access did not. According to reporting on the initial discovery, standard Windows utilities could show the normal GPU and memory temperature readings but not the hotspot value, leading many users to believe the capability had been removed from the hardware. Tom’s Hardware reported that Brazilian repair specialist Paulo Gomes demonstrated that the sensor could still be read with NVIDIA’s specialist MODS diagnostic tooling.
That distinction matters. There is a significant difference between a sensor never existing and a sensor existing but not being exposed to consumer-facing telemetry software. The latter means the data can potentially be decoded, validated, and made useful without redesigning the card itself.
The RTX 50 Hotspot Discovery
A normal core reading can hide a serious local thermal issue
The most compelling demonstration involved a Gigabyte GeForce RTX 5070 Ti sent in for overheating-related symptoms. In ordinary Windows monitoring applications, the card reportedly showed a GPU temperature in the 67°C to 68°C range. Yet, when inspected with the specialized diagnostic path, its hotspot rapidly reached 107°C under load. Tom’s Hardware’s account said that the card subsequently reduced clock speeds to protect itself.
This is exactly the failure mode that hotspot monitoring is designed to illuminate. The average temperature was not wrong in the sense that the broader die could genuinely be operating near that figure. But it was incomplete. The data omitted the worst-case region—the part of the silicon that determines whether thermal safeguards must intervene.
The reported repair investigation found poor thermal contact and inadequate thermal-interface material coverage. Replacing the existing material and correctly refitting the cooler reduced the reported hotspot from 107°C to 100°C in that specific case, restoring more stable behavior under load. PC Gamer’s reporting describes the example as a cooler-contact problem rather than proof of a universal RTX 50-series defect.
That qualification is crucial. One repair sample is not a statistically meaningful survey of the entire GeForce RTX 50 lineup. It does demonstrate, however, why owners and reviewers need access to the metric. Without it, an intermittent throttling problem can look like a driver, game-engine, power-delivery, or fan-control issue even when the root cause is mechanical thermal contact.
The access path was not a consumer feature
The early breakthrough relied on NVIDIA MODS, or Modular Diagnostic Software, which reporting describes as an internal diagnostic tool used in manufacturing, repair, and RMA-related contexts. Tom’s Hardware noted that it is not a normal public Windows utility and that its environment and use case are substantially different from standard monitoring software.
That means RTX 50 owners should not interpret the story as a reason to chase internal tools, leaked packages, or risky low-level modifications. The real consumer benefit came later, when established monitoring developers incorporated the newly understood telemetry into familiar applications. For Windows users, that is the preferable outcome: a supported, read-only sensor display rather than an improvised diagnostic workflow that could create security, stability, warranty, or data-integrity problems.
From Specialist Access to Mainstream Windows Monitoring
The important development is not merely that a hidden sensor was found. It is that the information made its way into tools that enthusiasts already use for sensor logging, overlays, system validation, and troubleshooting.
HWiNFO adds RTX 50 hotspot and per-chip VRAM telemetry
HWiNFO’s version history now explicitly lists GPU Hot Spot Temperature reporting for NVIDIA Blackwell and per-chip VRAM temperature monitoring for NVIDIA 30-series and later GPUs. The official HWiNFO changelog identifies the additions alongside a pre-release build, providing direct confirmation that the sensor work is no longer confined to a repair bench or a single proof-of-concept.
For Windows enthusiasts, HWiNFO is especially useful because it supports detailed sensor lists, current/minimum/maximum/average columns, logging, and integration with on-screen display ecosystems. An RTX 50 owner can therefore track whether a hotspot event is a momentary transient or a repeatable pattern that develops after twenty minutes of gaming, rendering, AI inference, or stress testing.
The addition of per-chip VRAM readings is equally significant. Memory is often cooled indirectly through pads, plates, or shared heatsink contact areas rather than through the same direct cold-plate arrangement used by the GPU die. A single VRAM temperature can identify the highest reported memory thermal value, but it cannot reveal whether one device is dramatically hotter than its neighbors.
With individual channels visible, the diagnosis becomes much more precise:
- One unusually hot chip may point to a misaligned or compressed thermal pad.
- A cluster of warmer chips may reveal uneven heatsink pressure or a localized airflow issue.
- Similar readings across all devices may indicate that the overall cooling design is operating as intended.
- Temperature behavior can be compared before and after a pad replacement, cooler remount, case-airflow change, or water-block installation.
HWiNFO’s changelog does not imply that all GPU models, board layouts, memory packages, or driver configurations will expose identical data. It does establish that granular VRAM telemetry is now part of the application’s NVIDIA monitoring work for RTX 30-series-and-newer hardware. HWiNFO’s release notes are therefore a better guide to feature availability than assumptions based on a single screenshot or forum post.
HWMonitor corrects its RTX 50 hotspot implementation
CPUID’s HWMonitor also moved quickly. Its official version history confirms that HWMonitor 1.65.1, released on July 16, 2026, included a fix for hotspot temperature on NVIDIA RTX 50 GPUs and credited PauloGomesTeam for help with hotspot reading and decoding. CPUID’s HWMonitor page is particularly notable because it documents both the feature and the fact that the telemetry required correction.
That correction is a healthy reminder that brand-new hardware telemetry should be treated carefully. Sensor names, offsets, scaling, register interpretation, polling behavior, and driver interactions can all complicate monitoring support. The first reading shown by a new version of a utility is not automatically the final word on a card’s thermals.
This does not diminish the value of the discovery. It reinforces a disciplined approach:
- Update monitoring software before drawing conclusions.
- Use the latest stable or documented pre-release version when a feature is newly introduced.
- Compare behavior across more than one utility where practical.
- Look for repeatable maximums during a consistent workload, rather than reacting to a single instant value.
- Correlate temperatures with clocks, power draw, fan speed, and actual performance.
If one tool reports a dramatic hotspot value while another does not, the correct response is not immediate panic or hardware disassembly. It is validation. Fresh sensor support can evolve quickly, as HWMonitor’s 1.65.1 correction illustrates. CPUID’s release history confirms that the company specifically addressed RTX 50 hotspot reporting soon after adding it.
Per-Memory Temperature Monitoring Changes the Diagnostic Picture
A single “memory temperature” was never the whole story
Before this breakthrough, GPU monitoring utilities already exposed some form of VRAM thermal data on many modern graphics cards. But the common reading was generally a single value—useful, certainly, but limited. It could represent the hottest available module rather than an average of all chips, meaning it could not explain how evenly the memory array was being cooled.
Paulo Gomes’ team reported that each memory module carried an individual temperature sensor, and that the usual software-reported figure was a hotspot-oriented value rather than an average. VideoCardz reported the team’s claim that individual sensors existed on every module they examined and that the legacy single reading had not conveyed a complete thermal distribution.
That changes how enthusiasts should think about “VRAM temperature.” It is no longer necessarily a singular condition of the memory subsystem. It may be the peak of a range.
For a GPU with several memory packages arranged around the processor, thermal uniformity depends on several physical variables:
- Pad thickness and compressibility
- Pad placement over each individual memory package
- Heatsink flatness
- Mounting pressure and screw tension
- Board-side versus cooler-side component placement
- Backplate effectiveness
- Fan direction and case airflow
- Load pattern, including gaming, compute, rendering, or AI workloads
A board can appear broadly well cooled while one memory chip runs substantially warmer because it has poorer contact with its thermal pad. Conversely, a high maximum memory value may be normal if the distribution is narrow and the card remains stable. Per-chip data makes those scenarios distinguishable.
Compatibility is broad, but not identical
The initial reporting described support for mobile GPUs with GDDR6 and desktop RTX 30- and RTX 40-series cards using GDDR6X, while noting that desktop GDDR6 cards did not initially expose the same individual measurements through the modding method. VideoCardz’s report is useful here because it avoids overstating compatibility: the capability was discovered across multiple products, not automatically across every NVIDIA board and memory arrangement.
Subsequent community work expanded the picture further for Blackwell. According to Tom’s Hardware, a Hotspot.dll plugin developed through a collective effort can expose hotspot temperature, die thermal channels, average die temperature, GPU memory junction temperature, and per-chip DRAM data. The report identifies compatibility across GDDR6, GDDR6X, and GDDR7 modules, including the RTX 50 product stack.
That does not mean every Windows user needs a plugin or should install experimental extensions blindly. The longer-term importance is that the decoding work appears to have provided a foundation for established software developers. The more these readings move into maintained applications with clear release notes and normal update mechanisms, the more valuable they become for ordinary troubleshooting.
What RTX 50 Owners Should Watch For
Temperature delta matters more than one isolated number
The most useful new figure is often not the hotspot temperature in isolation. It is the difference between the average GPU temperature and hotspot temperature, sometimes called the thermal delta. A modest gap can be expected because no die is thermally uniform. A large, repeatable, workload-specific gap—especially when paired with falling clocks or abnormal fan behavior—is a reason to investigate further.
The 68°C-average and 107°C-hotspot RTX 5070 Ti example was compelling precisely because the difference was so large and operationally meaningful. The card’s normal temperature looked fine, but the hotspot was associated with protection behavior and performance loss. PC Gamer’s coverage tied the discrepancy to poor thermal contact and reported improvement after the cooler interface was corrected.
Still, users should avoid declaring a card faulty simply because the hotspot is higher than the core temperature. Load, ambient temperature, cooler design, fan curve, power limit, case layout, and the particular game or compute task all influence the result. What matters is a complete pattern of evidence.
Build a useful monitoring baseline
A sensible Windows-based thermal check should collect more than one sensor. During a repeatable workload, monitor:
- GPU temperature
- GPU hotspot temperature
- GPU clock and effective clock
- GPU power draw
- Fan speed
- Memory junction temperature
- Individual VRAM chip temperatures, where exposed
- Frame rate and frame-time consistency
- Ambient room temperature, if possible
Run the same game scene, benchmark loop, or production workload more than once. Log the data for at least long enough to reach thermal equilibrium rather than relying on a brief startup spike. This makes it easier to identify a genuine mounting or cooling issue versus normal short-duration boost behavior.
For memory, watch the distribution, not merely the highest number. If every chip is in a similar range, the thermal solution is likely applying pressure and heat transfer fairly evenly. If one module stands apart from the rest, that is more informative than a broad “memory is hot” conclusion.
Use the data to guide—not replace—warranty support
Hotspot and per-chip readings are diagnostic evidence, not a license to dismantle every new graphics card. Removing a cooler can affect warranty coverage depending on the manufacturer, region, physical damage, and the terms of purchase. If a new RTX 50 card persistently throttles or produces an extreme thermal imbalance under stock settings, documenting the behavior with logs and contacting the board partner is often the lower-risk first move.
A useful support package includes:
- The graphics card model and serial information
- Driver version and monitoring-software version
- A sensor log from a repeatable workload
- Screenshots showing GPU temperature, hotspot, clocks, power, and fan speed
- A description of performance symptoms
- Confirmation that the card is operating at stock voltage and power settings, if applicable
This approach gives the manufacturer a much clearer starting point than “the card runs hot.” It also protects the owner from making invasive changes before establishing whether the product should be serviced or replaced.
The Strengths of This Community-Led Breakthrough
The first strength is transparency. RTX 50 owners can now inspect a dimension of GPU behavior that was materially relevant to performance and repair but unavailable through conventional consumer telemetry. The information reduces the chance that a problematic card will be dismissed merely because its average temperature appears acceptable.
The second is diagnostic precision. Hotspot telemetry can reveal a bad core-to-cooler interface. Per-chip memory telemetry can reveal uneven cooling across the VRAM array. Together, these readings turn generic thermal troubleshooting into targeted investigation.
The third is ecosystem responsiveness. The work moved from repair-specialist discovery to established utilities rapidly. HWiNFO officially documented Blackwell hotspot reporting and per-chip VRAM monitoring, while CPUID documented a rapid fix to its RTX 50 hotspot implementation. HWiNFO’s changelog and HWMonitor’s release history show how monitoring developers translated community findings into tools that Windows users can actually deploy.
Finally, the development strengthens independent PC hardware journalism and review methodology. Future GPU reviews can move beyond average core temperature and evaluate thermal spread, cooling uniformity, and behavior under longer sustained loads. That is especially useful for premium GPUs where buyers reasonably expect more than peak benchmark performance—they expect consistent clocks, manageable acoustics, and durable thermal engineering.
Risks, Caveats, and the Need for Better Official Telemetry
The clearest risk is misinterpretation. New sensors invite users to focus on the biggest number in a monitoring window without considering context. An elevated hotspot is a signal to investigate; it is not, by itself, a conclusive failure diagnosis.
Another risk is software immaturity. HWMonitor’s public acknowledgment that RTX 50 hotspot reporting was fixed in version 1.65.1 is an important example. CPUID’s documentation demonstrates that brand-new telemetry support can require revisions. Users should update tools, compare readings carefully, and avoid basing warranty claims or hardware modifications on a single unverified result.
There is also a security and support concern around specialist diagnostic tools. The original hotspot discovery involved NVIDIA’s internal MODS environment, not a conventional end-user utility. Tom’s Hardware’s report makes clear that this was not a typical Windows workflow. The community’s achievement should therefore be measured by its move into reputable monitoring software—not by encouraging users to seek unauthorized diagnostic packages.
Most importantly, the episode raises a broader product-design question: why should owners need reverse engineering to access basic health telemetry from a high-end consumer GPU? NVIDIA may have technical, validation, support, or product-segmentation reasons for controlling which values appear in public interfaces. But a sensor that can reveal a serious thermal-contact issue is difficult to characterize as irrelevant to consumers.
The strongest resolution would be official, documented access to validated hotspot and memory telemetry through NVIDIA’s public driver interface. That would allow monitoring developers to implement the readings consistently, reduce disagreement between tools, and give board partners a shared basis for support decisions.
A Better Thermal Toolkit for Windows Enthusiasts
The RTX 50 hotspot and per-memory temperature story is not about a hidden sensor suddenly making every Blackwell GPU suspect. It is about restoring visibility. The community has shown that average GPU temperature alone can be insufficient, particularly when a localized hotspot reaches a limit that affects boost clocks and overall performance.
For enthusiasts, the practical outcome is better evidence. HWiNFO and HWMonitor support means RTX 50 owners have a clearer route to detecting unusual thermal deltas, documenting performance-related throttling, and identifying whether VRAM cooling is evenly distributed. HWiNFO’s documented feature additions and CPUID’s RTX 50 hotspot fix mark the transition from an intriguing repair-lab discovery to a meaningful Windows PC maintenance tool.
That is ultimately the value of granular monitoring: not more numbers for their own sake, but the ability to connect temperatures with clocks, noise, stability, and real-world performance. For GeForce RTX 50 owners, GPU hotspot monitoring and per-chip memory temperatures make thermal diagnosis more honest—and substantially more useful.
