

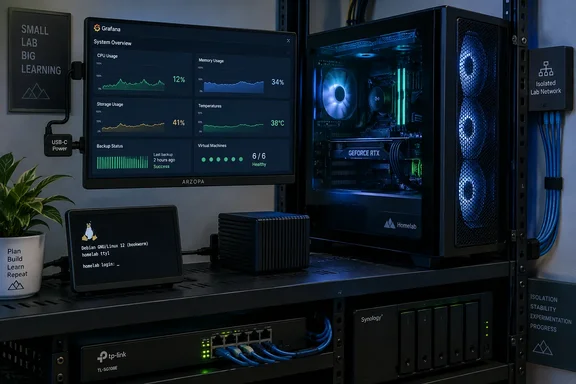
Saha’s September 17 report describes attaching a 1080p USB-C portable monitor to the side panel of a converted gaming-PC server, powering it from a motherboard USB port and feeding video from the processor’s integrated graphics output. The screen runs Grafana in Chromium through the Cage Wayland compositor, presenting Prometheus-collected statistics rather than a normal desktop.
For Proxmox VE users, that is a workable idea with one large qualification: a dashboard must not turn into an unauthenticated management surface. The article’s shortcut around Grafana login requirements is the part readers should examine most carefully before copying anything. A display that is intended to be visible from across a room does not need administrative access, and making it a browser session on the virtualization host creates a wider failure and security domain than the project initially suggests.
A local screen solves a real Proxmox failure mode
Proxmox VE is normally administered from another machine through its web interface, SSH, or API. That is efficient until the issue is precisely the thing those paths depend on: a bad network configuration, a failed bridge, a hung browser connection, a DNS problem, or an incomplete update that leaves the host reachable only at the physical console.
Saha’s small HDMI display provides a simple out-of-band fallback for that category of problem. If the host has an iGPU enabled, connecting a display to the motherboard video output gives the administrator a local login prompt without rolling in a separate crash cart. That can be especially handy for a single-node homelab where there is no IPMI, iDRAC, iLO, PiKVM, or serial-console infrastructure.
There is a more modest benefit, too. A dashboard in the same room makes degrading conditions visible before they become an outage: storage filling up, a backup task still running, a node unexpectedly rebooting, a VM consuming all available memory, or temperatures moving outside their normal range. The display cannot fix those conditions, but it can cut the time between “something is wrong” and “someone notices.”
The portable-monitor approach has practical appeal because it needs far less furniture and cabling than a conventional display. Saha says his panel draws 12 watts and is powered through USB-C, though that number is specific to his unspecified monitor and should not be generalized. Many portable panels require more power than a motherboard USB-A port reliably supplies, particularly at full brightness; others use USB-C for both video and power but cannot accept a USB-A connection for the same job.
Anyone reproducing the hardware portion should confirm three things before buying or mounting a screen:
- The motherboard firmware must expose the integrated GPU while a discrete GPU is installed, if the system has both.
- The display’s stated power requirement must be within what the selected USB port and cable can deliver.
- The mounting method must not block intake vents, place sustained load on a tempered-glass panel, or leave the monitor’s weight dependent on adhesive that may soften under heat.
A side-mounted monitor is a convenience device, not an engineered rack console. That is fine in a lab, provided its installation remains reversible and does not compromise cooling or access to the case.
Keep the dashboard off the Proxmox host where possible
The more consequential design choice is where the graphical kiosk runs. Saha avoids installing a complete desktop environment and instead uses Cage to launch Chromium fullscreen on a virtual terminal. Cage’s own project documentation describes a systemd-based kiosk model that can replace a getty on a chosen TTY and start an application automatically at boot. It is designed for this sort of single-purpose display.
But a Proxmox node is a hypervisor first. Adding a graphical compositor, browser, automatic login, dashboard configuration, and their package dependencies directly to the host makes that host less minimal and introduces another path that can be affected by operating-system upgrades or dependency changes. A browser rendering a local web page may seem harmless, yet it is still a complex process running on the same machine responsible for guest workloads and storage access.
A cleaner layout separates the jobs:
- Run Prometheus exporters or Proxmox metric collection on the host only where necessary.
- Put Prometheus and Grafana in a dedicated LXC container or on another low-power machine.
- Run Cage and Chromium on a separate kiosk device when possible, pointing it at the Grafana dashboard.
- Reserve the physical display connection on the Proxmox host for the actual Linux and Proxmox console.
That arrangement retains the advantage of the portable display while ensuring a broken kiosk browser does not become part of the hypervisor’s normal operating state. It also creates a useful distinction during incident response: the host console remains a recovery tool, while the dashboard remains an observability tool.
If a separate kiosk device is not available, using an LXC container for Grafana and Prometheus—as Saha did for the monitoring services—is still preferable to placing those services directly on the Proxmox host. Proxmox’s administration documentation includes configuration for external metrics servers, reflecting that monitoring is intended to integrate with systems beyond the core host management interface.
“Read-only” does not make anonymous Grafana safe by itself
Saha writes that he disabled Grafana login requirements and enabled administrative access to automate the display, then kept the Grafana container “read-only.” The report does not publish the exact Grafana configuration, so it is impossible to determine whether the kiosk receives anonymous Viewer access, a dashboard-specific permission, or something broader.
Those are very different security postures.
Grafana’s documentation distinguishes between organization-level Viewer, Editor, and Admin roles, plus the self-hosted server-administrator role. A Viewer can be appropriate for a screen that only displays charts. An organization administrator or server administrator is not. Grafana also warns that anonymous access requires careful configuration of the permitted organization and other access controls to prevent unauthorized access.
The central problem is that container filesystem permissions and Grafana authorization are separate controls. Mounting a container’s filesystem read-only may limit changes inside that container, but it does not determine which Grafana dashboards, folders, data sources, annotations, or query results the browser session can access. The dashboard itself can still expose operational details such as internal IP addresses, storage names, node names, VM names, usage trends, and alert states.
For a homelab screen, the safer design is straightforward:
- Create a dedicated Grafana organization or folder for the wall display.
- Give anonymous access, if it is required at all, only the Viewer role.
- Use a dashboard that contains no controls, editable variables, administrative panels, credentials, or sensitive labels.
- Bind Grafana to a private management network, firewall it to the kiosk and trusted administrator devices, and do not publish it through a router port-forward.
- Keep a separate authenticated Grafana account for editing dashboards and data sources.
Grafana’s permission model also has an important behavior administrators should remember: it applies the highest permission a user has through organization, folder, and dashboard rules. Assigning a lower permission at one level does not override a more generous permission inherited elsewhere. A “view-only dashboard” therefore deserves a real permission review, not an assumption based on the kiosk’s appearance.
The monitor should display health, not invite intervention
A good homelab dashboard is intentionally boring. It should show facts that let someone decide whether to investigate: host reachability, CPU load, memory pressure, storage capacity, disk I/O latency, network traffic, running backup jobs, replication status, guest count, and the state of important containers or VMs.
Avoid putting the Proxmox web UI itself on a permanently logged-in, unattended display. The visual result might resemble a dashboard, but it leaves a management interface available to anyone who reaches the keyboard or mouse. The same caution applies to browser-saved credentials and to Grafana panels that expose direct links into administrative tools.
Saha’s use of Chromium locked to one dashboard URL is sound as a kiosk concept. The missing operational detail is recovery behavior. A reliable kiosk should restart the browser after a crash, reconnect after the dashboard service restarts, blank or show a clear error rather than dropping into a usable desktop, and leave the underlying local console accessible only through deliberate administrative action.
The physical screen also does not replace remote management. It can help identify a host that has stopped responding, but it cannot help when nobody is near it. For systems that run important workloads, an independent management path—at minimum a documented SSH recovery method and ideally a remote console solution—remains more valuable than any wall display.
A useful upgrade, provided it remains a peripheral
MakeUseOf’s project lands on a sensible conclusion: a small display can make a homelab more approachable and provide a quick sanity check when the server is in the room. The equipment cost can be low, and the console fallback is a legitimate advantage over a headless machine with no remote-management hardware.
The technical lesson is narrower than “buy a portable monitor.” Use the screen as a passive status board, and preserve the Proxmox host as a deliberately boring hypervisor. Put monitoring and the kiosk session outside the host where possible; if they must remain nearby, confine them with a separate container, a least-privilege Grafana viewer configuration, and network restrictions.
That leaves the portable panel doing its best job: showing that the server is healthy—and becoming a console only when the normal tools are not.
References
- A portable monitor was the best upgrade I made to my Proxmox homelab MakeUseOf · 2026-09-17T10:30:16+00:00