Please followup with my suggestion from the post above
Link Removed follow the instruction regarding all slots referenceing the SPD Tab as well as the Memory tab and zipping and uploading the export html report from RAMMon.
And do this one again also
Link Removed follow the instructions regarding right clicking the executeable and choosing to run as administrator.
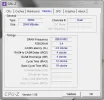
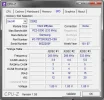
Both of the two most recent .dmp files you posted are identifiing Memory Corruption as the issue so we need to take a look at your memory settings or you can identify your particular memory manufacturer, model name and number, and check their website for the proper settings in reference to frequencies, voltages and timings. Of course if you are overclocking anything (memory, cpu, graphics card, etc.,) now would be a good time to reset everything to default settings (setup defaults, optimized defaults, performance defaults) something like that depending on your BIOS.
Your drivers look pretty good right now even though the debugger is still indicating that a driver might be responsible, this could also be an issue with your onboard memory so you should probably use
MemTest86 download the latest zipped ISO (4.20) extract it and burn the ISO to a CD, boot the PC from the CD and test each stick individually (7 to 10 passes). Onces you have found a stick that passes flawlessly, use that stick to test each individual memory slot 7 to 10 passes.
DUMPS:
Code:
......
*******************************************************************************
*                                                                             *
*                        Bugcheck Analysis                                    *
*                                                                             *
*******************************************************************************
Use !analyze -v to get detailed debugging information.
BugCheck 100000C5, {6300012, 2, 1, 8251e5a0}
Probably caused by : memory_corruption
Followup: memory_corruption
---------
0: kd> !analyze -v
*******************************************************************************
*                                                                             *
*                        Bugcheck Analysis                                    *
*                                                                             *
*******************************************************************************
DRIVER_CORRUPTED_EXPOOL (c5)
An attempt was made to access a pageable (or completely invalid) address at an
interrupt request level (IRQL) that is too high.  This is
caused by drivers that have corrupted the system pool.  Run the driver
verifier against any new (or suspect) drivers, and if that doesn't turn up
the culprit, then use gflags to enable special pool.
Arguments:
Arg1: 06300012, memory referenced
Arg2: 00000002, IRQL
Arg3: 00000001, value 0 = read operation, 1 = write operation
Arg4: 8251e5a0, address which referenced memory
Debugging Details:
------------------

BUGCHECK_STR:  0xC5_2
CURRENT_IRQL:  2
FAULTING_IP:
nt!ExAllocatePoolWithTag+596
8251e5a0 8902            mov     dword ptr [edx],eax
CUSTOMER_CRASH_COUNT:  1
DEFAULT_BUCKET_ID:  CODE_CORRUPTION
PROCESS_NAME:  csrss.exe
LAST_CONTROL_TRANSFER:  from 8246f770 to 8251e5a0
STACK_TEXT:
80df9be8 8246f770 00000000 000001fc 20707249 nt!ExAllocatePoolWithTag+0x596
80df9c1c 8248ca8a 0000000b 00000000 824ad6f0 nt!IopAllocateIrpPrivate+0x148
80df9c30 824ad6f0 0000000b 00000000 85680640 nt!IoAllocateIrp+0x14
80df9c54 824b301e 85745958 00000043 85680648 nt!IoPageRead+0x60
80df9cac 82467264 85afac30 776c1000 85680611 nt!MiIssueHardFault+0x28c
80df9d1c 8243eaa8 00000000 776c1000 00000001 nt!MmAccessFault+0x25b9
80df9d1c 778055c0 00000000 776c1000 00000001 nt!KiTrap0E+0xdc
WARNING: Frame IP not in any known module. Following frames may be wrong.
0028f1f4 00000000 00000000 00000000 00000000 0x778055c0

STACK_COMMAND:  kb
CHKIMG_EXTENSION: !chkimg -lo 50 -d !nt
    8251e0d0 - nt!ExAllocatePoolWithTag+cb
 [ 89:88 ]
1 error : !nt (8251e0d0)
MODULE_NAME: memory_corruption
IMAGE_NAME:  memory_corruption
FOLLOWUP_NAME:  memory_corruption
DEBUG_FLR_IMAGE_TIMESTAMP:  0
MEMORY_CORRUPTOR:  ONE_BIT
FAILURE_BUCKET_ID:  MEMORY_CORRUPTION_ONE_BIT
BUCKET_ID:  MEMORY_CORRUPTION_ONE_BIT
Followup: memory_corruption
Code:
---------
0: kd> !analyze -v
*******************************************************************************
*                                                                             *
*                        Bugcheck Analysis                                    *
*                                                                             *
*******************************************************************************
KERNEL_MODE_EXCEPTION_NOT_HANDLED_M (1000008e)
This is a very common bugcheck.  Usually the exception address pinpoints
the driver/function that caused the problem.  Always note this address
as well as the link date of the driver/image that contains this address.
Some common problems are exception code 0x80000003.  This means a hard
coded breakpoint or assertion was hit, but this system was booted
/NODEBUG.  This is not supposed to happen as developers should never have
hardcoded breakpoints in retail code, but ...
If this happens, make sure a debugger gets connected, and the
system is booted /DEBUG.  This will let us see why this breakpoint is
happening.
Arguments:
Arg1: c0000005, The exception code that was not handled
Arg2: 9011a733, The address that the exception occurred at
Arg3: 81617c08, Trap Frame
Arg4: 00000000
Debugging Details:
------------------

EXCEPTION_CODE: (NTSTATUS) 0xc0000005 - The instruction at 0x%08lx referenced memory at 0x%08lx. The memory could not be %s.
FAULTING_IP:
win32k!zzzSetFMouseMoved+8
9011a733 0000            add     byte ptr [eax],al
TRAP_FRAME:  81617c08 -- (.trap 0xffffffff81617c08)
ErrCode = 00000002
eax=00003400 ebx=00000000 ecx=ff1df470 edx=ff5d0578 esi=ff1df470 edi=00000000
eip=9011a733 esp=81617c7c ebp=81617c7c iopl=0         nv up ei pl nz ac po cy
cs=0008  ss=0010  ds=0023  es=0023  fs=0030  gs=0000             efl=00010213
win32k!zzzSetFMouseMoved+0x8:
9011a733 0000            add     byte ptr [eax],al          ds:0023:00003400=??
Resetting default scope
CUSTOMER_CRASH_COUNT:  1
DEFAULT_BUCKET_ID:  CODE_CORRUPTION
BUGCHECK_STR:  0x8E
PROCESS_NAME:  csrss.exe
CURRENT_IRQL:  0
LAST_CONTROL_TRANSFER:  from 900e7aed to 9011a733
STACK_TEXT:
81617c7c 900e7aed 00000000 8247d674 00000001 win32k!zzzSetFMouseMoved+0x8
81617cc8 9009d33e 00000004 0085fd28 901629aa win32k!ProcessQueuedMouseEvents+0x1a3
81617d04 900ad7b7 00000004 00000002 80e0d400 win32k!RawInputThread+0x55d
81617d18 901629c5 00000004 0085fd28 81617d34 win32k!xxxCreateSystemThreads+0x4a
81617d28 8247f8ba 00000004 0085fd68 771e70b4 win32k!NtUserCallNoParam+0x1b
81617d28 771e70b4 00000004 0085fd68 771e70b4 nt!KiFastCallEntry+0x12a
WARNING: Frame IP not in any known module. Following frames may be wrong.
0085fd68 00000000 00000000 00000000 00000000 0x771e70b4

STACK_COMMAND:  kb
CHKIMG_EXTENSION: !chkimg -lo 50 -d !win32k
    9011a730 - win32k!zzzSetFMouseMoved+5
 [ 81:80 ]
1 error : !win32k (9011a730)
MODULE_NAME: memory_corruption
IMAGE_NAME:  memory_corruption
FOLLOWUP_NAME:  memory_corruption
DEBUG_FLR_IMAGE_TIMESTAMP:  0
MEMORY_CORRUPTOR:  ONE_BIT
FAILURE_BUCKET_ID:  MEMORY_CORRUPTION_ONE_BIT
BUCKET_ID:  MEMORY_CORRUPTION_ONE_BIT
Followup: memory_corruption