Windows 10 Random BSODs since December 2020

Well HWiNfo will keep the highest and lowest readings attained. I'd try that as a start off.. You may be surprised.
 
Usually I'm running Core Temp in the background, with it set to display the current temp on the Dock. Trouble is, when the machine BSODs, it completely fills the display (while leaving the desktop contents of the 2nd monitor visible) so I can no longer see the Dock to observe what the displayed temperature was at the moment the machine BSODed.

Anyway, its been almost exactly one week since my last BSOD, and by that, I mean it happened at almost exactly the same time of the day and at exactly the same sort of virtual-world event as last time. 0o I was at a music club event in Second Life, and had been at it for almost 2 hours. I go to several of these a week, though, and often am there 3 to 4 hours at a time, so its unlikely its THIS that's causing the crash.
 

Attachments

  • 022621-73921-01.dmp
    671.9 KB · Views: 164
Code:
*******************************************************************************
*                                                                             *
*                        Bugcheck Analysis                                    *
*                                                                             *
*******************************************************************************

MEMORY_MANAGEMENT (1a)
    # Any other values for parameter 1 must be individually examined.
Arguments:
Arg1: 0000000000041790, A page table page has been corrupted. On a 64 bit OS, parameter 2
    contains the address of the PFN for the corrupted page table page.
    On a 32 bit OS, parameter 2 contains a pointer to the number of used
    PTEs, and parameter 3 contains the number of used PTEs.
Arg2: fffff200080575e0
Arg3: 00000000000001ff
Arg4: 0000000000000200

Debugging Details:
------------------


KEY_VALUES_STRING: 1

    Key  : Analysis.CPU.mSec
    Value: 2093

    Key  : Analysis.DebugAnalysisProvider.CPP
    Value: Create: 8007007e on DESKTOP-OCRAVIG

    Key  : Analysis.DebugData
    Value: CreateObject

    Key  : Analysis.DebugModel
    Value: CreateObject

    Key  : Analysis.Elapsed.mSec
    Value: 2105

    Key  : Analysis.Memory.CommitPeak.Mb
    Value: 78

    Key  : Analysis.System
    Value: CreateObject


ADDITIONAL_XML: 1

OS_BUILD_LAYERS: 1

DUMP_FILE_ATTRIBUTES: 0x8
  Kernel Generated Triage Dump

BUGCHECK_CODE:  1a

BUGCHECK_P1: 41790

BUGCHECK_P2: fffff200080575e0

BUGCHECK_P3: 1ff

BUGCHECK_P4: 200

BLACKBOXBSD: 1 (!blackboxbsd)


BLACKBOXNTFS: 1 (!blackboxntfs)


BLACKBOXPNP: 1 (!blackboxpnp)


BLACKBOXWINLOGON: 1

CUSTOMER_CRASH_COUNT:  1

PROCESS_NAME:  opera.exe

Hi,

as you can see the dump is a memory management issue Bugcheck 1a.

The process being blamed is Opera.exe so check for any extensions that may cause an issue (does Opera even have extensions like google?).

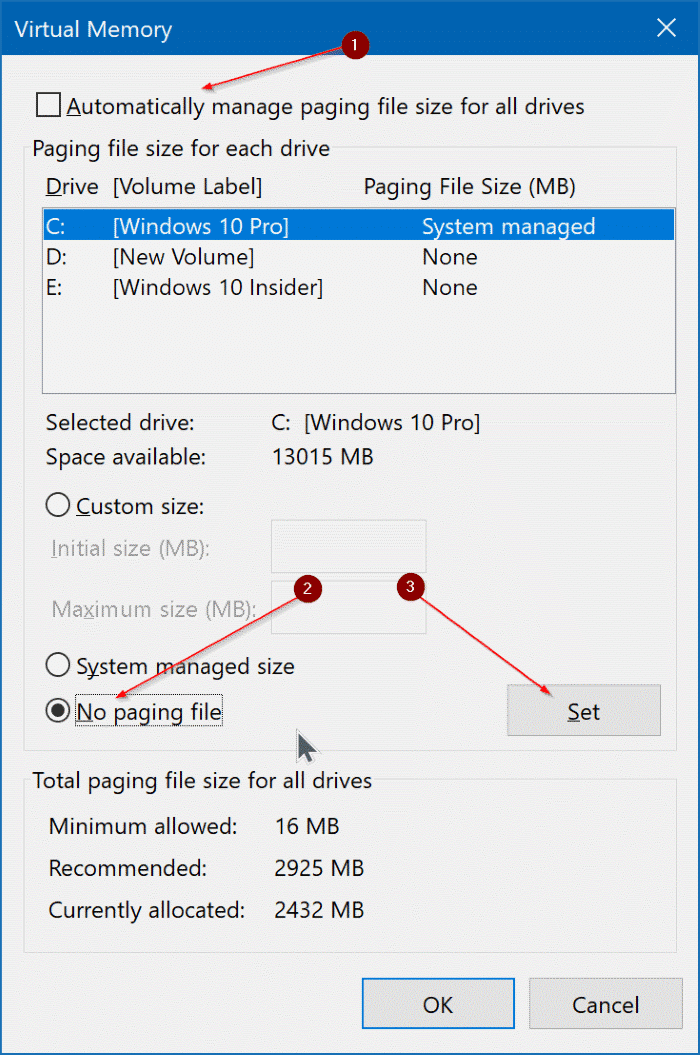
Something else you could try is recreating your pagefile.

Basically turn it off, reboot and pop it back on. Sometimes they can become fragmented and corrupt.

As you know bugcheck 1a is a possible memory issue but see if checking out the other suggestions help.
 
Well, I just had another BSOD, and it was while I was trying to look at something in Telegram while watching a video feed in Discord, while Docker Desktop is again stuck all day in Starting. I suspect whatever is causing the BSOD might be making the minidump finger the wrong thing when things crash, though, because when I was having the BSODs a few weeks ago, it was different programs each time being implicated.... tho most of the recent ones, about which I was posting the minidumps to here, on about all of them, I was told it seemed to be HyperV triggering it. And since Docker Desktop has been back to stuck at Starting.... for the past day or two, my hangs and BSODs have gone way up again. 0o

I mean, I went a WEEK without BSODs, and now I'm having multiple system crashes again. And it seems to be only after Docker has gone back to stuck at Starting... again. Gah! I'm of half a mind to rip Docker out of my machine and fling it across the room! 0O Virtually speaking, of course.

New minidump attached.

edit: That said, what do I do to recreate (that is, how do I turn off and back on) the pagefile?
 

Attachments

  • 022821-71093-01.dmp
    1.2 MB · Views: 168
Last edited:
Code:
*******************************************************************************
*                                                                             *
*                        Bugcheck Analysis                                    *
*                                                                             *
*******************************************************************************

MEMORY_MANAGEMENT (1a)
    # Any other values for parameter 1 must be individually examined.
Arguments:
Arg1: 0000000000041792, A corrupt PTE has been detected. Parameter 2 contains the address of
    the PTE. Parameters 3/4 contain the low/high parts of the PTE.
Arg2: ffffce800042dca0
Arg3: 0000000000000010
Arg4: 0000000000000000

Debugging Details:
------------------


KEY_VALUES_STRING: 1

    Key  : Analysis.CPU.mSec
    Value: 1718

    Key  : Analysis.DebugAnalysisProvider.CPP
    Value: Create: 8007007e on SINGULARITY

    Key  : Analysis.DebugData
    Value: CreateObject

    Key  : Analysis.DebugModel
    Value: CreateObject

    Key  : Analysis.Elapsed.mSec
    Value: 2906

    Key  : Analysis.Memory.CommitPeak.Mb
    Value: 91

    Key  : Analysis.System
    Value: CreateObject


ADDITIONAL_XML: 1

OS_BUILD_LAYERS: 1

DUMP_FILE_ATTRIBUTES: 0x8
  Kernel Generated Triage Dump

BUGCHECK_CODE:  1a

BUGCHECK_P1: 41792

BUGCHECK_P2: ffffce800042dca0

BUGCHECK_P3: 10

BUGCHECK_P4: 0

MEMORY_CORRUPTOR:  ONE_BIT

BLACKBOXBSD: 1 (!blackboxbsd)


BLACKBOXNTFS: 1 (!blackboxntfs)


BLACKBOXPNP: 1 (!blackboxpnp)


BLACKBOXWINLOGON: 1

CUSTOMER_CRASH_COUNT:  1

PROCESS_NAME:  DiscordPTB.exe

MODULE_NAME: hardware

IMAGE_NAME:  memory_corruption

STACK_COMMAND:  .thread ; .cxr ; kb

FAILURE_BUCKET_ID:  MEMORY_CORRUPTION_ONE_BIT

OSPLATFORM_TYPE:  x64

OSNAME:  Windows 10

FAILURE_ID_HASH:  {e3faf315-c3d0-81db-819a-6c43d23c63a7}

Followup:     MachineOwner
---------

Discord. You may have some kind of issue with your memory modules.

Did you run sfc /scannow?

(Err.. sorry this video is a bit old but still valid)

For the pagefile adjustment:

I would then set it back to automatic on the next reboot if at all possible.

Did this just start happening recently? I would check the Windows System File Integrity first... perhaps even check the disk for errors (got to File Explorer, right-click the C drive, Properties (at the bottom) -> Tools -> Error checking -> Check -> Scan Drive
 
Okay, I did the sfc /scannnow thing a day or two before your post, and it found no troubles to fix. And I have now done the delete and re-enable Pagefile thing. I'll see if that changes things.

edit: And then it BSODed again, while I was idly watching a live feed on Discord. Minidump attached.

On the other hand, after this restart, I find the docker has gone back to launching the container right again. What in the petunias of heck?!?

As for CPU heat matters that someone earlier mentioned, I'm not sure what all I can do about that. I had this "your heat is too high" thing brought up ages ago, like maybe mid 2019, and in fact the 60 to 70 degrees heat has been what Core Temp has routinely been showing me for several years, and the machine has behaved fine in (mostly) all that time. And some other forums I've looked at, on the subject of "the temperatures for this model of CPU you're describing are too hot!" I see other people saying that some other experts are saying this is overrated, but I can't find the threads at the moment.

That said, the heatsink I have on the CPU is one of these size-of-Cleveland things with fins sticking up a few inches above the CPU and fanning several inches or more out to the sides of the CPU. (I don't remember exactly, might have been 3 or 4 inches tall and 5 or 6 inches across, or it might have been bigger and taller than that, but it was something I'd picked because it was beefier than the regular heatsink.) It's a giant, stonking heatsink I also have several LARGE (5" across) fans blowing out from various places on the case. Why would that NOT be cooling the case phenomenally well? At that, placing my hand against where the fans are blowing out, I don't feel a huge amount of heat coming out, and I definitely feel airflow. I mean, its noticeably warm, but it's not exactly scalding hot. Do I maybe have the fans placed in the wrong place, and they're leaving "dead zones" in the case where air isn't being pulled from at all?
 

Attachments

  • 030121-59968-01.dmp
    440.2 KB · Views: 161
Last edited:
Well, I redid the thermal paste two years ago, under the advice that it might have dried out or something, and it made zero difference in the heat issue then either. I tried looking for an even beefier heat sink back then, and the only ones for this motherboard and processor that I could find that were bigger literally required me to pull the motherboard out and install a different base plate for the heat sink under the motherboard before I could install the heatsink, basically take the entire machine completely apart and put it all back together again... and there was no way I was going through with all THAT. 0O
 
Well I mean at 70C it is high but thats still not enough to generate errors. If its idling at 70C, yeah I think that might be a problem. If its 70C at full load, then no its not an issue. What matters is if the die temp gets too high it will throttle, it shouldn't really BSOD like that unless it truly is getting too hot... then you may have memory issues in Windows that "appear" as a result of this instability. I am wondering how much RAM you have in the system. If its more than one module you could try taking one out, run memtest+, see if the system crashes. Swap the one RAM module with the other RAM module, run the test again, etc. to rule out an issue with the hardware RAM.

But definitely make sure the CPU is not overheating at full load first, because that could be the cause of your instability. You can do this with software like prime95 or some other freeware benching software.
 
Yeah, the temp is usually idling at about 60 to 65 degrees. I've not seen the Core Temp show anything above 70, though.

I have 32gigs of ram in this machine. Two pairs of ram chips, each stick is 8gigs. I actually did the memtest thing some weeks ago, per instructions on another forum, and got LOTS of errors at a BUNCH of ram addresses on the first leave-it-run-overnight test, pulled the machine out, switched out the position of the first pair of ramchips with the second pair, ran the memtest again..... and got ONE, and ONLY one, error address in the whole thing. Dunno what was up with that one. 0o
 
I wouldn't use prime95 either especially with those temps..
 
Well, it's at 65 to 68 right now with me having regular programs running, like all my chat programs (Pidgin, Telegram, Discord, etc), web browser with lots of tabs open, Thunderbird open with a LOT of mailboxes, and such, and I'm not running anything strenuous like games or such, (I don't run strenuous games, anyway.) But its been like that since ages ago. Like, at least since mid 2019.
 
Last edited:
So it's not exactly idle really.

Whats the temp with absolutely nothing running but windows
 
Look the max working temp for your chip by AMD is 62c so your at that already.

At 70c the chip will throttle and above that shut down.

It is recommended you keep to a working temp of no higher than 55c otherwise the life of the chip will be potentially shortened

edit:

Even this doesn't turn out to be the actual issue it's something you need to sort out imo. I'd invest in a decent aio.
 
Invest in a decent... whut? What's an AIO?

Anyway, I have a LOT of stuff that launches at startup (i.e. many of the chat programs, some support aps), and some things that I then launch at manual fairly early on (i.e. the web browser, the email program, some more chat stuff...).

edit: Actually, sometimes it does drop to between 52 to 62, as it is right now. It was in the 60s when I was watching a youtube video, and now is more like 55 to 56.
 
Last edited:
Actually, sometimes it does drop to between 52 to 62, as it is right now. It was in the 60s when I was watching a youtube video, and now is more like 55 to 56.
TJ max (temperature junction maximum) for this CPU is 70C, whereas the CPU will throttle to stop damage. Most likely what is happening, as @kemical alludes to, is that you are hitting above, at, or near it and the CPU is shutting down. You should check the CPU fan and heatsink looking for debris or a slow down of the fan. Most likely, if permanent damage has not already been done, you will want to reseat the processor with new thermal paste or thermal padding. If you stress the CPU too much under these conditions, it can stop working altogether, or what does happens in some cases, it can even lose its ability to regulate the temps properly, because parts of the internal components literally start to melt. I didn't realize the temp limit on this one is so low, so even if its at 50C-60C on idle that's not good.

I actually did the memtest thing some weeks ago

It will not be reliable with your system in its current state. As the CPU is on and functioning during the test, it can fail based on that alone.
 
Last edited:
Back
Top Bottom