

 Prepare a safe, short capture
Procmon can collect enormous numbers of events quickly. A focused trace is safer for the computer, easier to analyze, and less likely to expose unrelated user activity in a log you later share.
Before you begin:
- Download Process Monitor from Microsoft Sysinternals and extract the archive to a local folder, such as
C:\Tools\ProcessMonitor. - Use the executable matching the device architecture:
Procmon.exefor 32-bit Windows.Procmon64.exefor 64-bit Windows.Procmon64a.exefor Windows on ARM.
- Sign in with an account that can run software as administrator.
- Close unrelated programs where practical, especially applications handling sensitive documents, passwords, or customer data.
- Decide exactly how you will reproduce the issue before capturing. For example: “Launch ContosoApp, open the report, then wait for the access error.”
- Plan to capture only the few seconds needed for the action. Do not leave Procmon recording while you work normally.
Warning: A Procmon trace can contain file paths, usernames, command lines, Registry data, and details of applications running on the PC. Treat.pmlcaptures as potentially sensitive diagnostic material. Review them before sharing outside your organization.
Start Process Monitor and reset prior filters
- Open the folder containing Process Monitor.
- Right-click the appropriate Procmon executable and select Run as administrator.
- Accept the Sysinternals license prompt if it appears.
- If the Process Monitor Filter window opens automatically, select Reset to remove saved filters from an earlier session.
- If Procmon is already open and you want to reset its filter state, select Filter on the menu bar, then select Reset Filter.
Resetting is important when you are investigating a new problem. An old include or exclude rule can hide the event that explains the failure. - Confirm that capture is active. Procmon normally begins recording when it starts. You can toggle recording with Ctrl+E or by selecting File > Capture Events.
- Do not reproduce the issue yet if Procmon has been collecting events for a long time. Stop the capture with Ctrl+E, close Procmon, and reopen it so you begin with a small, time-relevant capture.
A small capture is generally more useful than a large one. Procmon’s filters are non-destructive, meaning you can apply and remove display filters without deleting already recorded events. That lets you capture the necessary moment first and refine your view afterward.
Capture the application activity
The most dependable approach is to start recording shortly before the failing action, then filter the completed trace. This avoids missing activity from a launcher, helper process, or child process that starts before the main application appears.
- With Procmon open and filters reset, press Ctrl+E if capturing is not already enabled.
- Wait a moment, then perform the exact action that causes the behavior you are investigating.
Examples include:- Starting an application that fails to open.
- Opening a file that produces an error.
- Saving to a location that unexpectedly reports access problems.
- Triggering a feature that hangs, crashes, or cannot find a dependency.
- Once the error, crash, or unexpected result occurs, immediately press Ctrl+E again to stop capture.
- Leave Procmon open. The recorded events remain available for filtering and review.
For a launch failure, include the entire launch sequence. Start capture before double-clicking the application shortcut or running the program from its normal entry point. Do not start recording only after an error dialog appears; the relevant file or Registry operation has often already occurred.
Find the app and apply a process filter
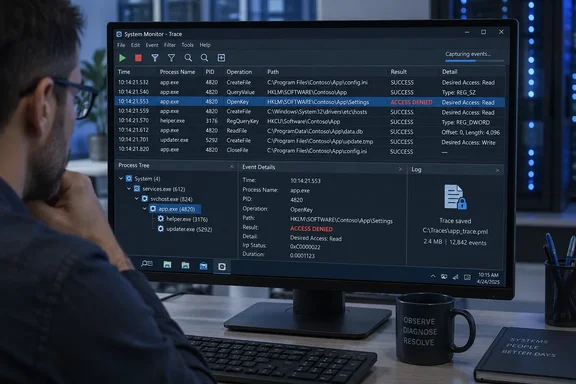
A target application may create helper processes, and a shortcut may launch a different executable than expected. Procmon’s Process Tree is useful for identifying the process that actually ran during the trace.
- Select Tools > Process Tree.
- Look for the target program by its executable name. If you launched an app through another process, expand the relevant branch to locate child processes.
- Select the target executable in the process tree.
- Right-click it and select Add Process to Include Filter.
- Close the Process Tree window or select OK when prompted.
Procmon now displays events for the selected process while preserving the rest of the capture in the underlying log. The main event list is easier to read when you focus on these columns:
- Time of Day — helps you align the trace with the moment of failure.
- Process Name — identifies the executable making the request.
- PID — distinguishes separate instances of the same executable.
- Operation — shows the type of activity, such as file creation, Registry access, process creation, or thread exit.
- Path — shows the file, folder, Registry location, or process-related target.
- Result — reports the result returned to the application.
- Detail — provides operation-specific context, such as requested access or options.
If the application exits immediately, scroll toward the end of the filtered events. A cluster of Thread Exit events followed by Process Exit indicates that the process ended. If Windows Error Reporting starts afterward, you may also see activity for WerFault.exe, which is a sign that the application reached an unrecoverable condition.
Inspect file and Registry activity
With the process filter active, review the trace in the order the events occurred. The goal is not to treat every unusual-looking line as an error. Instead, identify activity immediately before the user-visible failure or process exit.
Look for missing files, folders, or dependencies
In the Result column, look for entries that suggest the target was not found. Then inspect the corresponding Path and Operation fields.
Useful questions include:
- Is the application searching in an unexpected folder?
- Is a configuration file, data file, plug-in, DLL, or executable missing?
- Does the application find a file in one location, then fail when accessing a different location?
- Is a redirected user profile, network path, removable drive, or application data directory involved?
Open an event by double-clicking it to inspect its properties. The detail view can reveal the access requested, the process identity, and other operation data that does not fit in the event list.
A missing-file result is not automatically a defect. Many Windows applications probe multiple optional locations before finding the correct one. The important pattern is repeated failure on a path that should exist, particularly when it immediately precedes the application error.
Look for Registry access issues
Registry activity is shown in the same event list. Filtered events may show the application reading settings from its user or machine configuration locations, checking file associations, loading component configuration, or querying installed software information.
When a Registry operation looks relevant:
- Double-click the event.
- Confirm the Process Name and PID match the program you are investigating.
- Check the Path to identify the exact Registry key or value involved.
- Review the Result and Detail fields.
- Compare the behavior with a known-good PC only if the same application version, user scenario, and configuration apply.
Warning: Do not change Registry permissions, delete keys, or grant broad access solely because Procmon shows an access failure. Some denied requests are expected, including requests for access the process is not entitled to receive. A permission change made to “fix” one trace line can weaken security or break other software.
If an access problem appears immediately before failure, verify it before making any change. Compare permissions and ownership with a working machine where available, confirm the identity under which the application runs, and use the least-privileged correction appropriate to the application’s documented requirements.
Find access failures without guessing
For launch failures and feature failures, access results are often the first useful place to investigate.
- Keep the target process filter active initially.
- Select Tools > Count Occurrences.
- In the field selector, choose Result.
- Select Count.
- Review the list for access-related failures, then double-click a result such as ACCESS DENIED to filter to the corresponding events.
- Examine each matching event in context: the operations immediately before and after it, the exact path, and the requested access shown in the event detail.
Not every ACCESS DENIED event is causal. Microsoft specifically notes that requests for “All Access” are frequently denied and may be expected. Focus on denied operations that occur at the point of failure and involve a resource the application demonstrably needs.
If the target process is not in the Process Tree, remove the process filter with Filter > Reset Filter, then search the full short capture again. The activity may belong to a launcher, service, broker, updater, shell extension, or another parent process rather than the executable you expected.
Save the trace correctly
Save a native Procmon log whenever you may need to reopen it, compare it, or provide it to a developer or support engineer.
- Select File > Save.
- Choose All events.
- Choose Native Process Monitor Format (PML).
- Select a protected local folder and assign a meaningful name, such as
ContosoApp-launch-access-denied.pml. - Save the file.
Choosing All events preserves the whole captured record, including events currently hidden by filters. That matters because another analyst may need to remove filters, examine a parent process, or investigate a second symptom. The PML format retains data needed for a later Procmon session.
Avoid saving only displayed or highlighted events unless you intentionally want a reduced excerpt. A filtered export can omit the process or operation required to explain the problem.
Use a backing file for controlled longer captures
For a short, manually controlled trace, Procmon can retain events using virtual memory. However, leaving a virtual-memory-backed capture running can consume available virtual memory and make the PC unresponsive.
For a capture that must run longer, use File > Backing Files and select a named backing file. Set a sensible maximum size before leaving the trace unattended.
Warning: A file-backed capture can fill the selected drive if its maximum size is not defined. Use a local drive with adequate free space, set a limit, and stop the capture as soon as the reproduction window ends.
A backing file is appropriate when you must catch an intermittent event, but it is not a substitute for a capture plan. Record the approximate time of the failure so you can locate the relevant interval afterward.
Capture from an elevated command prompt when no desktop is available
If you need to trace a machine through a console session, Procmon can start minimized and write directly to a backing file.
- Create a folder for the tool and trace, such as
C:\ProcessMonitor. - Open Command Prompt or Windows PowerShell as administrator.
- Start a 64-bit capture with:
C:\ProcessMonitor\procmon64.exe -accepteula -backingfile C:\ProcessMonitor\Recording.pml -quiet -minimized - Reproduce the problem.
- Stop and finalize the capture with:
C:\ProcessMonitor\procmon64.exe -terminate -quiet - Open
Recording.pmlin Process Monitor for analysis.
Use the executable that matches the target system architecture. This method is especially useful when the desktop is unstable or when you need a capture to start with minimal user interaction.
Troubleshoot common Procmon capture problems
The event list is empty or does not change
- Capture may be paused. Press Ctrl+E or select File > Capture Events to resume it.
- A prior filter may be hiding every event. Select Filter > Reset Filter and check again.
- Procmon may not have sufficient elevation for the activity you need. Close it and relaunch it with Run as administrator.
The application is missing from the Process Tree
- The executable may have started and exited before you opened Process Tree. Start a new short trace and begin capturing before launching the app.
- The visible application may be started by a separate launcher, broker, service, or helper process. Reset the filter and inspect processes around the failure time.
- Confirm the expected executable name. A product name and its process filename are often different.
There are too many events to interpret
- Stop the capture sooner and reproduce only one action.
- Use Process Tree to add the target application to an include filter.
- Use Count Occurrences on Result to identify recurring failure results.
- Inspect the final seconds before an error dialog, process exit, or crash report rather than reading from the beginning.
The trace shows ACCESS DENIED, but changing permissions does not help
- Treat the denied request as evidence to investigate, not proof of the root cause.
- Confirm that the denied path is required for the failing feature.
- Check whether the same application continues successfully after the event.
- Compare against a working device or account before changing permissions.
- If multiple machines fail, use a clean comparison system and add policies or configuration changes incrementally until the failure returns.