
For organizations that have spent years building DLP policies but still struggle to articulate operational outcomes, this is potentially a meaningful change. A DLP deployment can generate alerts, block sharing, warn users, and feed incidents into Microsoft Defender—but an organization still needs to answer a basic management question: Are the teams responsible for these alerts meeting the response commitments they made to the business?
That is the gap Microsoft Purview’s planned dashboard is intended to close.
 Overview: Turning DLP Alert Queues Into Measurable Operations
Microsoft Purview DLP is designed to identify, monitor, and protect sensitive data across Microsoft 365 workloads, endpoints, and other supported locations. Its policies evaluate content using techniques including keyword matches, regular expressions, validation functions, proximity evidence, and machine-learning-based detection methods—not merely simple text matching. Microsoft Learn
In practical terms, DLP may identify an employee attempting to email customer financial records outside the company, upload regulated data to an unauthorized destination, paste sensitive text into a browser form, copy protected files to removable media, or share sensitive documents externally. Policy actions can range from user notifications and policy tips to auditing, blocking, overrides, and incident reporting. Microsoft Learn
The issue is that detection alone is not a complete control. If an alert remains unreviewed for days, if ownership is unclear, or if remediation occurs after exposed data has already spread, the organization’s DLP program may look technically active while still being operationally ineffective.
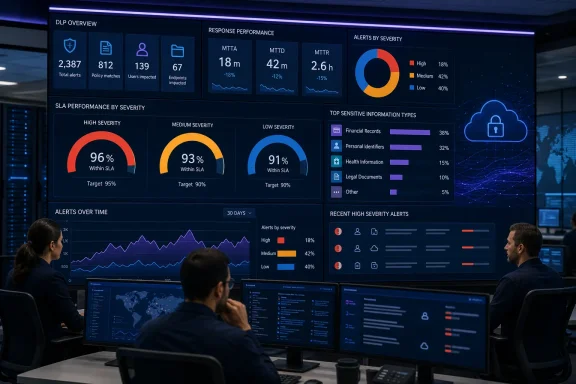
The proposed Microsoft Purview Data Loss Prevention SLA Based Alert Reporting Dashboard aims to give DLP teams a more direct operational lens. Rather than looking only at alert volume or policy matches, they will be able to assess whether their alert-investigation workflow performs against agreed service levels.
According to the roadmap description, the dashboard will include:
- Out-of-box reporting for MTTA, MTTD, and MTTR.
- Past-trend visibility for DLP alert operations.
- Reporting on the top sensitive information types (SITs) exposed through DLP alerts.
- Custom SLA definitions for high-, medium-, and low-severity alerts.
- Operational-performance and SLA metrics intended to show how well teams are handling alert workloads. Microsoft 365 Roadmap
That combination matters because it joins two sides of a mature data-protection program: the quality of detection and the quality of response.
Why MTTA, MTTD, and MTTR Matter in Data Loss Prevention
The three proposed metrics are familiar to security operations teams, but their value in a DLP context deserves closer examination.
Mean Time to Detect
MTTD measures the elapsed time before an issue is detected. In a DLP environment, this metric needs careful interpretation because an alert can be generated almost immediately after a policy rule is matched, while the underlying risky activity may have begun earlier.
For example, a DLP policy may alert when a user attempts to send a message containing a threshold number of financial identifiers to an external recipient. Yet the broader risk could involve a longer chain of actions: data collection, file creation, staging, sharing, and repeated attempts to move the material. Microsoft’s existing DLP alert capabilities can be configured to raise single-event alerts or aggregated alerts based on matching thresholds and time windows, which affects how organizations should understand the detection timestamp. Microsoft Learn
A useful SLA dashboard must therefore distinguish between a quick alert generated from a policy match and meaningful detection of the underlying incident. The roadmap does not yet publish its exact calculation logic, so organizations should avoid assuming that MTTD will represent a universally standardized event-to-detection duration. Instead, administrators should validate precisely which timestamps Purview uses when the preview arrives.
Mean Time to Acknowledge
MTTA is often the most immediately actionable metric. It measures how long an alert waits before someone takes responsibility for it.
That matters in DLP because alert severity does not always map neatly to business urgency. A high-severity alert tied to a potential exposure of regulated data may deserve immediate attention, while a lower-severity alert from a known false-positive-prone policy might fit a longer review window. The planned ability to define SLAs by high, medium, and low severity gives organizations a way to encode those differences directly into their operating model. Microsoft 365 Roadmap
A strong MTTA measurement can reveal several recurring problems:
- Alerts are generated outside the hours covered by the investigation team.
- Ownership rules are unclear between compliance, legal, security operations, and insider-risk teams.
- Analysts are buried beneath excessive low-quality alerts.
- High-severity notifications are not receiving differentiated treatment.
- Escalation workflows depend on manual triage or email forwarding.
An acknowledgment metric cannot prove that an investigation was good. It does, however, establish whether an alert was picked up promptly enough to begin a credible response.
Mean Time to Resolve
MTTR is the metric most likely to attract executive attention, and for good reason. It shows how long alerts or associated incidents stay open before they reach a resolution state.
Microsoft Defender’s DLP investigation workflow already supports incident-level investigation, filtering, tagging, assignment, and resolution. It can also correlate DLP alerts with alerts from other Microsoft security products, allowing investigators to view related activity together instead of treating every event as an isolated compliance issue. Microsoft Learn
But a short MTTR is not automatically a sign of a strong program. Teams can close alerts quickly by deciding they are benign, by suppressing noisy detections, or by using minimal documentation. Conversely, a complex alert involving legal holds, user interviews, security containment, and notification obligations may appropriately take longer to resolve.
The dashboard’s most valuable use will be to identify outliers and trends, not to turn every case into a race against a stopwatch.
The Importance of Severity-Specific SLAs
A single response target for every DLP alert rarely reflects reality. The roadmap’s stated ability to define custom SLAs for high, medium, and low severities is one of the most useful parts of the planned feature. Microsoft 365 Roadmap
High-Severity Alerts Need a Different Operating Model
A high-severity DLP alert may involve data that is commercially sensitive, legally protected, regulated, or associated with a potential insider-risk concern. Microsoft notes that setting a DLP incident-report severity to High is required when organizations want incident information to flow to Purview Insider Risk Management. Microsoft Learn
That makes high-severity tuning especially important. If high severity is assigned too broadly, incident queues become crowded and meaningful escalation signals weaken. If it is reserved too narrowly, serious events might not receive the urgency they require.
A practical high-severity SLA framework could include:
- Rapid acknowledgment by an appropriately authorized analyst.
- Initial scope assessment to determine whether the alert represents a blocked attempt, successful sharing event, repeated behavior, or a false positive.
- Containment decisions where available, such as unsharing a file or applying appropriate protection.
- Escalation to legal, privacy, HR, insider-risk, or incident-response teams when the evidence meets defined criteria.
- Documented resolution, with reasons for closure and policy-improvement recommendations where needed.
The proposed dashboard will not create this workflow automatically. It can, however, make failures in the workflow visible.
Medium Severity Is Where Efficiency Is Won or Lost
Medium-severity alerts often make up the operational middle ground: important enough to investigate, but not necessarily urgent enough to interrupt every other task. This category is commonly where teams discover whether their triage process is scalable.
If medium-severity MTTA gradually increases while high-severity figures remain healthy, that may indicate a staffing problem, a backlog problem, an overly broad policy, or a prioritization issue. If MTTR expands only for certain policies or data types, it may identify a need for better runbooks or clearer remediation authority.
A dashboard that can chart those trends over time could support a more nuanced conversation than “we have too many alerts.” It can help a team identify which category, which policy, or potentially which sensitive data pattern is consuming the most operational attention.
Low Severity Should Not Become a Blind Spot
Low severity does not mean irrelevant. It may cover behavior that is informational, low impact, or likely to be routine—but repeated low-severity activity can reveal a broader control problem.
For example, a large number of low-severity alerts involving one sensitive information type may point to:
- A business process that routinely moves sensitive data in an unsafe way.
- An insufficiently precise DLP rule.
- Confusing user guidance or policy tips.
- An application integration that needs a sanctioned alternative.
- A classification definition that requires refinement.
The danger is allowing low-severity alerts to become permanent backlog inventory. A severity-specific SLA should make it possible to set a sensible review target without pretending that every low-severity event deserves the same immediate treatment as a serious exfiltration concern.
Top Sensitive Information Types: From Alert Volume to Risk Intelligence
The roadmap specifically highlights top SITs getting exposed via DLP alerts. That sounds like a small reporting addition, but it may become one of the dashboard’s most useful capabilities. Microsoft 365 Roadmap
Sensitive information types are the classification building blocks used across Microsoft Purview. Microsoft provides built-in SITs for common categories of sensitive data, and organizations can also build custom SITs or use exact data match classification for records that should be compared against known values. Microsoft Learn
A top-SIT view can help answer questions that a simple total-alert count cannot:
- Which types of data are driving the most DLP events?
- Are financial, health, government ID, credential, or proprietary-data detections increasing?
- Which sensitive data categories create the most high-severity incidents?
- Are recurring alerts tied to a specific department, workload, application, or business process?
- Are custom SITs generating unusually high volumes of false positives?
- Are users repeatedly encountering the same policy tips because the policy does not align with their work?
This is where security metrics can become governance metrics. If a particular SIT dominates alerts, the response may not be to tighten controls further. It may instead involve changing a process, providing a secure data-sharing channel, updating user training, or tuning the sensitive-information definition.
Microsoft cautions that poorly tuned custom sensitive information types can create excessive classification traffic, particularly for endpoint DLP, because files may be classified against all SITs available in a tenant. Microsoft Learn A top-SIT dashboard can potentially make those tuning issues easier to spot—though organizations will still need to investigate whether a high alert count reflects genuine exposure, policy breadth, or detection noise.
How the New Dashboard Fits With Microsoft Defender XDR
Microsoft Purview is not replacing the Microsoft Defender portal’s incident-investigation capabilities. Instead, the planned dashboard appears positioned as a complementary reporting layer.
Microsoft recommends the Defender XDR dashboard as the location for investigating and managing DLP alerts, while the Purview portal remains the recommended place for creating and editing DLP policies. Microsoft Learn Within Defender, organizations can view DLP alerts grouped into incidents, correlate them with other security alerts, search by policies and users, apply tags, and take certain remediation actions on users, files, and devices. Microsoft Learn
The distinction is important:
- Defender XDR is where investigators work cases.
- Purview DLP policies determine what is detected and what actions occur.
- The planned SLA dashboard should help managers understand whether that combined operating model is meeting commitments over time.
A DLP analyst needs detailed context: who triggered the alert, what policy matched, which file or message was involved, what sensitive information was detected, and what action is possible. Microsoft’s documentation describes alert details that can include severity, alert status, policy name, involved files, and user information, depending on permissions and workflow. Microsoft Learn
A program owner, by contrast, needs trendlines: whether high-severity alerts are acknowledged within target, whether unresolved cases are accumulating, and whether certain data categories or policies are creating disproportionate operational pressure. The new dashboard should help provide that higher-level view.
The Strengths of an Out-of-Box SLA Dashboard
The strongest argument for this feature is not that organizations cannot calculate these metrics today. Many can, using exports, incident-management tools, SIEM workflows, custom Power BI reports, or data pipelines.
The advantage is that native reporting reduces friction.
Less Dependence on Manual Reporting
Custom reporting frequently depends on several fragile steps: identifying the right alert timestamps, exporting data consistently, normalizing severity fields, reconciling alert and incident status, writing calculations, and maintaining dashboards after product changes.
An out-of-box Microsoft Purview SLA reporting dashboard could reduce that burden substantially. For smaller compliance teams, the difference between “possible with engineering effort” and “available in the portal” can determine whether meaningful service measurement happens at all.
Better Executive Reporting
Security and compliance leaders need concise, defensible ways to explain performance. Raw counts of DLP alerts are often misleading. An increase in alerts could indicate worsening behavior, better policy coverage, a new workload being onboarded, or simply an overly broad rule.
SLA-oriented measures offer a more operationally grounded narrative:
- High-severity acknowledgments are improving.
- Medium-severity backlog is rising.
- Resolution time has increased for a particular class of sensitive data.
- A new policy caused an alert surge but was tuned within a defined period.
- SLA breaches are concentrated in a specific handoff between teams.
That is a much more useful discussion than treating total alerts as the sole health metric.
Consistency Across Teams
Large organizations often have fragmented ownership. Security operations may investigate endpoint signals; compliance teams may own DLP policy design; legal may determine notification obligations; data-governance leaders may define classification standards.
A common dashboard can help establish a shared vocabulary. MTTA, MTTD, MTTR, severity, SLA attainment, and top SITs are metrics that different teams can discuss without losing sight of their distinct responsibilities.
Risks and Limitations to Watch Closely
The roadmap entry is promising, but organizations should avoid treating dashboard availability as proof of program maturity.
Metrics Can Be Gamified
Any measured SLA can encourage unhealthy behavior if it becomes a blunt performance target. Analysts may acknowledge alerts prematurely, close cases with insufficient investigation, or prioritize easy resolutions at the expense of difficult but significant incidents.
To counter that risk, organizations should pair speed metrics with quality measures such as:
- Reopened-case rates.
- Repeat alerts involving the same user or business process.
- False-positive and false-negative review findings.
- Documentation completeness.
- Escalation accuracy.
- Policy-tuning outcomes after recurring alerts.
A fast closure that leaves the underlying issue unresolved is not a successful DLP outcome.
Alert Quality Still Determines Dashboard Quality
DLP reports only what policies detect. Poorly scoped conditions, overly broad sensitive-information definitions, inconsistent severity mapping, or missing workloads will produce misleading results no matter how polished the reporting interface appears.
Microsoft’s DLP guidance emphasizes the need to define control objectives, tune conditions, refine sensitive-information definitions, adjust scopes, and add controls as policies move toward production use. Microsoft Learn The dashboard can illuminate operational symptoms, but it cannot replace that policy-design discipline.
Severity Must Reflect Business Impact
The planned dashboard’s high-, medium-, and low-severity SLA controls will only be as useful as the organization’s severity framework. A severity label should reflect more than the number of data matches. It may need to consider the data category, destination, user role, whether the action was blocked, whether an override was used, the history of the account, and the likely business impact.
Without that calibration, high severity becomes noisy, medium severity becomes an unmanageable catch-all, and low severity becomes ignored.
Preview Timing Is Not a Final Delivery Guarantee
Microsoft currently lists the feature as in development, with Preview expected in August 2026 and General Availability expected in September 2026. Microsoft also states that roadmap dates and descriptions are estimates subject to change, and that features may be postponed, changed, or removed. Microsoft 365 Roadmap
That does not diminish the feature’s significance, but it does mean organizations should plan for evaluation rather than build critical compliance commitments around unverified preview behavior. Exact dashboard fields, calculation formulas, permissions, retention behavior, licensing requirements, and export options have not been detailed in the roadmap item.
Preparing for Preview Without Waiting for the Dashboard
Organizations do not need to wait for August to improve DLP operations. The upcoming dashboard should be treated as a chance to formalize the service model that will make its metrics meaningful.
Establish a Clear Alert Lifecycle
Start by documenting the lifecycle for each severity band:
- Alert generation: Define which policies should create alerts and under what conditions.
- Triage: Identify the team or role responsible for initial review.
- Acknowledgment: Specify what counts as ownership and when escalation begins.
- Investigation: Define required evidence, contextual checks, and decision criteria.
- Containment and remediation: Clarify what teams can unshare, block, relabel, remove, or escalate.
- Resolution: Require consistent statuses, closure reasons, and documentation.
- Policy feedback: Turn investigation findings into policy tuning, user education, or process changes.
This is particularly important because DLP alerts can be created as single events or aggregated events. Those configurations influence alert volume and the meaning of response-time metrics. Microsoft Learn
Review Permissions Before Reporting Goes Live
Access to DLP alerts and their contextual content should follow least-privilege principles. Microsoft’s guidance distinguishes between permissions needed to manage alerts and elevated permissions needed to view content previews or matched sensitive content. Microsoft Learn
The same principle applies to SLA reporting. Managers may need trend-level visibility without seeing the sensitive content behind every alert. Analysts may need sufficient detail to investigate. Compliance teams may need auditing capabilities. Defining those roles now will make dashboard adoption smoother and reduce unnecessary exposure of sensitive data.
Baseline Existing Performance
Before the native dashboard arrives, organizations should establish a baseline using their current tools. Even imperfect manual reporting can identify starting values for:
- Alert volume by severity.
- Acknowledgment time.
- Time to closure.
- Open-alert backlog.
- Recurring policy matches.
- High-volume sensitive information types.
- Cases requiring legal, HR, privacy, or security escalation.
When Purview’s SLA dashboard becomes available, those baselines can help teams determine whether the native calculations align with their existing methodology and whether operational performance is actually improving.
A More Accountable Future for Purview DLP Operations
Microsoft Purview’s planned SLA-based DLP alert reporting dashboard is notable because it recognizes a reality that many data-protection programs have struggled with: a policy match is not the final outcome. The organization must acknowledge the alert, investigate intelligently, take appropriate action, document the decision, and improve the controls that produced the event.
By bringing MTTA, MTTD, MTTR, trend reporting, severity-based SLA configuration, and top-SIT visibility into an out-of-box Purview experience, Microsoft is aiming to make that operational responsibility more visible. Microsoft 365 Roadmap
The dashboard will be most valuable for organizations that resist the temptation to use it as a scorecard for speed alone. Its real purpose should be to expose bottlenecks, improve policy quality, align teams around accountable response targets, and focus attention on the sensitive data that is actually driving DLP risk.
For Windows and Microsoft 365 administrators, the forthcoming feature represents a shift from simply asking whether Purview is generating alerts to asking the question that matters more: whether the organization is acting on them well enough.
