
The key is to stop treating one utilization number as a verdict. A game can be CPU-limited while total CPU usage looks modest, especially on a processor with many logical cores. It can also show low GPU usage because a frame-rate cap, V-Sync, menu screen, or background window is deliberately limiting rendering. The useful diagnosis comes from matching the game’s behavior with the resource that is saturated at the same moment.
Open Task Manager with Ctrl + Shift + Esc, select the expanded view if necessary, and leave it open on a second display or use Alt + Tab immediately after a repeatable stutter. Test in the same scene for at least a minute: a busy city, multiplayer fight, shader-heavy area, or any place where frame pacing goes bad. Idle desktop readings and game menus are poor evidence.
 Start with the Processes tab
The Processes tab is the quickest way to identify a competing workload. Click the CPU, Memory, Disk, or GPU column heading to sort by that resource, then look for a process that stays near the top while the game is running.
A healthy gaming session will often show the game executable at or near the top of the GPU list, while CPU use may be split among the game, the browser, voice chat, anti-cheat, launcher services, RGB utilities, recording software, and Windows components. The goal is not to make every background process disappear. It is to find an unusual process consuming a meaningful share of the same resource the game needs.
Watch for these patterns:
- A browser tab, game launcher update, cloud-sync client, antivirus scan, or Windows Installer process consuming sustained CPU time can worsen a CPU-bound game, particularly on four- or six-core systems.
- A process showing persistent disk activity while the game hitches may point to downloads, shader-cache work, asset streaming, or insufficient available memory forcing paging.
- A recording or streaming tool can consume GPU time on a video-encode engine, system memory, CPU cycles, or all three, depending on its configuration.
- A process using substantial memory is not automatically a problem. It becomes relevant when overall memory use is high and the system begins moving active data between RAM and storage.
Sort by CPU first, then by Memory and Disk. Do not end a process simply because it is unfamiliar; use the process name, publisher, and search function in Task Manager before changing anything. Killing a Windows service, security product, driver helper, or game anti-cheat component may destabilize the game or remove a protection layer without solving the bottleneck.
If the game’s GPU column appears low, look at GPU engine as well. Right-click a column heading and enable it if it is not already visible. A game should normally use a 3D engine on the discrete GPU, but a laptop may expose both an integrated GPU and a discrete GPU. If the game is running on GPU 0’s 3D engine while GPU 1 is the high-performance card, the issue may be graphics-device selection rather than a CPU limit.
Use Performance to separate total load from a CPU limit
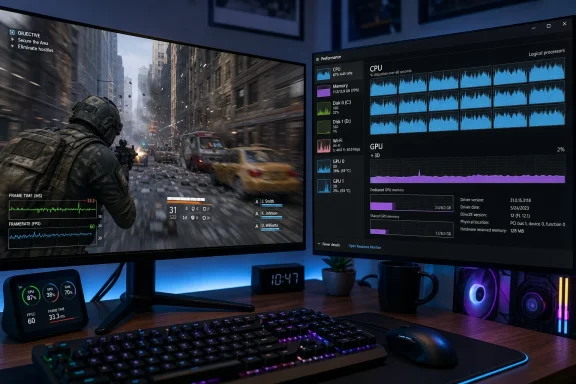
Select Performance, then click CPU. The default graph shows total processor use across every logical processor. That is useful for spotting system-wide saturation, but it can conceal the kind of limit games frequently hit: one or a few overloaded threads.
Right-click the CPU graph and choose Change graph to > Logical processors. Task Manager will show a graph for each logical CPU. Microsoft’s troubleshooting guidance makes the arithmetic clear: on an eight-logical-processor system, one fully busy logical processor represents only about 12.5 percent of total CPU capacity. A game can therefore be bottlenecked by a primary game thread, render-submission thread, simulation thread, or asset-streaming worker well before the total CPU chart reaches 100 percent.
A likely CPU limit looks like this: one or more logical-processor graphs repeatedly hit or nearly hit 100 percent during the same moments that the frame rate drops, while the GPU’s 3D workload has room left. The game may also improve when you lower CPU-heavy settings such as view distance, crowd density, simulation quality, physics detail, world streaming, or draw distance—but show little improvement when you reduce texture resolution or rendering resolution.
Do not interpret a single core at 100 percent as proof by itself. Windows moves threads between logical processors, so the busy graph can change from one core to another. What matters is a persistent pattern of one or several logical processors reaching their limit at the bad moments, combined with a GPU that is not being kept busy.
Task Manager can also show kernel times by right-clicking the CPU graph and selecting Show kernel times. A large kernel component during a hitch suggests CPU time is being spent in operating-system or driver work rather than entirely in the game’s user-mode code. That observation is a reason to investigate drivers, hardware monitoring tools, storage activity, network adapters, or other system software; it is not a reason to randomly disable Windows services.
Read the GPU graph by engine, not by one percentage
Click the relevant GPU under Performance. On systems with both integrated and discrete graphics, identify the GPU connected to the display and the GPU the game is actually using. Task Manager numbers these devices as GPU 0, GPU 1, and so on; the numbering is not a performance ranking.
Microsoft’s DirectX team explains that Task Manager’s headline GPU percentage represents the busiest engine rather than a simple average of all engines. That is the right choice for gaming diagnosis, because a fully used 3D engine should not be diluted by idle copy, video-decode, or compute engines. Still, the graph is only meaningful if you are viewing the engine the game is actually using.
Click a graph label and choose 3D where available. A conventional GPU-limited game will usually keep the discrete GPU’s 3D engine close to its practical ceiling in the demanding scene, while CPU use is not visibly pinned on a critical logical processor. Reducing resolution, render scale, ray tracing, anti-aliasing, shadows, or other GPU-intensive settings should then produce a measurable frame-rate gain.
Low GPU use has several competing explanations:
- A CPU-limited game cannot prepare or submit work quickly enough to keep the GPU’s 3D engine busy.
- A frame cap, V-Sync, VRR target, foreground-frame limiter, or game menu may intentionally leave GPU capacity unused.
- The game may be using the integrated GPU rather than the discrete GPU.
- A GPU driver problem, power-saving mode, thermal throttling, or a background GPU workload may interfere with normal performance.
- The game may be waiting on storage, memory, network activity, shader compilation, or its own internal loading process.
This is why “GPU at 60 percent” is an observation, not a diagnosis. First remove artificial limits for a controlled test: use an uncapped frame rate only briefly, test a demanding gameplay area rather than a menu, and ensure the game window is in the foreground. Then compare the GPU’s 3D graph with the logical-processor graphs.
Memory and storage can mimic a CPU bottleneck
Select Memory in Performance and look at the amount in use and available. High RAM use alone is not conclusive; Windows is designed to cache data and use spare memory productively. The warning sign is a stuttering workload accompanied by very low available memory, rising disk activity, and growing committed memory as the game loads a new area or runs for a long session.
In the Processes tab, sort by Memory and Disk during the problem. If the game, browser, capture software, mod manager, or background application collectively fills physical RAM, Windows may need to retrieve pages from storage. The result often feels like intermittent pauses rather than a steady low frame rate.
The GPU page adds another check. Task Manager distinguishes dedicated GPU memory—normally the VRAM on a discrete graphics card—from shared GPU memory borrowed from system RAM. A game pressing close to the dedicated-memory limit can suffer from texture pop-in, hitching, or abrupt frame-time spikes as assets are evicted and reloaded.
Use the Performance GPU memory total as the primary system-level view. Microsoft documents a known Windows 10 issue in which the Details tab’s per-process Dedicated GPU memory counter can overstate usage in some cases. Per-process GPU-memory values are still helpful for identifying which program is involved, but they should not be summed or treated as the final VRAM total; shared allocations can appear against more than one process.
Use Details when the Processes tab is too coarse
The Details tab removes app grouping and exposes individual executables. This is useful for games that launch separate renderers, anti-cheat services, crash handlers, launchers, or helper processes. Right-click a column heading, choose Select columns, and add CPU time, Threads, GPU, GPU engine, Dedicated GPU memory, and Shared GPU memory as needed.
CPU time is cumulative, so it does not show an instant bottleneck by itself. It is useful for confirming which process has done substantial work over the course of a session. The live CPU and GPU columns show the immediate contention; Threads can provide context when a helper process suddenly expands during a problem, but thread count is not a performance score.
The GPU engine column is especially valuable on multi-GPU machines. It reveals whether the game’s reported GPU activity is occurring on a 3D engine and identifies the GPU number. If a laptop game is mistakenly attached to an integrated GPU, correct the graphics preference in Windows Settings or the graphics-driver control panel, then retest before buying hardware or changing in-game settings.
Task Manager is not a frame-time analyzer, profiler, or thermal monitor. If it identifies a persistent CPU or GPU limit but cannot explain recurring short spikes, the next step is a proper capture with Windows Performance Recorder and Windows Performance Analyzer, or a game-focused frame-time tool. Microsoft’s Windows Performance Toolkit is built for tracing CPU work at process and thread level when Task Manager’s live graphs are no longer enough.
For most players, though, the actionable result is simpler: remove the process competing for the saturated resource, lower settings that load that resource, verify the correct GPU is in use, and test again in the exact scene that exposed the problem. A CPU upgrade only makes sense after Task Manager shows the game repeatedly exhausting critical logical processors while the GPU is waiting; a graphics upgrade only makes sense when the game consistently keeps the correct GPU’s 3D engine busy.
