

launch.json file, but only if VS Code is using the same Python interpreter that runs your project from the terminal. That interpreter choice is the part beginners most often miss: a breakpoint can be perfectly valid while the debugger launches an unrelated global Python installation that does not contain the project’s packages.
Microsoft’s current VS Code documentation separates the Python language tools from the Python Debugger extension, which uses debugpy to pause code, step through execution, inspect variables, and run expressions in the Debug Console. The Python extension can offer the debugger during setup, but verify that both pieces are present before treating a failed debugging session as a code problem.
Open the project folder in VS Code rather than opening an individual .py file by itself. A folder workspace gives the debugger a stable ${workspaceFolder}, lets VS Code save reusable settings under .vscode, and prevents relative file paths from changing depending on how the script was launched.
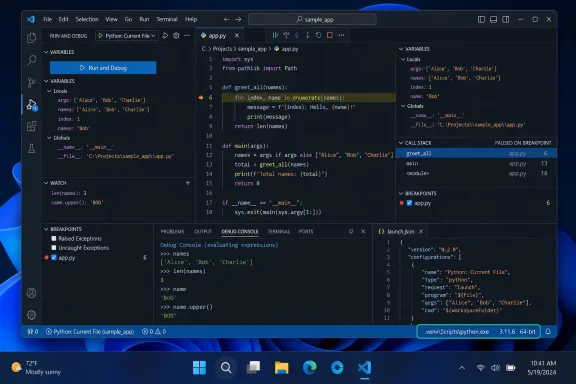 Install the extensions and choose the interpreter
Install Python for Windows first if it is not already available. In VS Code, open the Extensions view with Ctrl+Shift+X, search for Python, and install the Microsoft extension identified as ms-python.python. Then search installed extensions for Python Debugger and make sure Microsoft’s ms-python.debugpy extension is enabled.
The second extension is worth checking explicitly. Older tutorials often describe Python debugging as a single bundled feature, but Microsoft now distributes the debugger separately. If VS Code offers to install it when you try to debug, accept the prompt; if it does not, install it from Extensions.
Next, tell VS Code which Python installation belongs to the project:
- Press
Ctrl+Shift+P. - Run
Python: Select Interpreter. - Choose the interpreter that should run this project.
The selection appears in the lower-right Status Bar. For a virtual environment created inside the project, the useful entry commonly resembles .venv\Scripts\python.exe; a system-wide installation typically shows a Python version and an install path. Do not select by version number alone if several entries say Python 3.12 or Python 3.13. Expand or hover over entries and verify the path.
A selected interpreter affects more than the Run button. Microsoft documents that it supplies the environment for language features, new terminals, normal execution, and debugging. In practice, this means imports, package versions, and environment-specific settings can all differ if you switch from the project virtual environment to global Python.
If there is no project environment yet, create one before debugging package-dependent code. Open the Command Palette, choose Python: Create Environment, select Venv, choose a base Python interpreter, and let VS Code create .venv in the workspace. Select it afterward if VS Code has not already done so.
For a quick Windows sanity check, open a new integrated terminal with Ctrl+` and run:
python -c "import sys; print(sys.executable)"
The printed path should match the environment selected in VS Code. If it does not, close that terminal, reselect the interpreter, and open a new terminal. Existing terminals can retain the environment that was active when they started.
Stop execution where the bug happens
Create a small script named debug_demo.py in the project folder:
from pathlib import Path

def load_names(filename):
    path = Path(filename)
    names = path.read_text(encoding="utf-8").splitlines()
    return [name.strip().title() for name in names if name.strip()]

def main():
    names = load_names("data/names.txt")
    for position, name in enumerate(names, start=1):
        print(f"{position}: {name}")

if __name__ == "__main__":
    main()
Create data\names.txt below the workspace folder and add a few names, one per line. Click in the narrow left gutter beside this line:
names = load_names("data/names.txt")
VS Code places a red dot there: a breakpoint. Press F5, or open the arrow beside the editor’s Run button and select Python Debugger: Debug Python File. The program should pause before the marked line executes.
The debugger only stops at code that actually executes. A hollow gray breakpoint can indicate that VS Code has not yet bound it to executable code, while a breakpoint inside a function will never be reached if the function is never called. If the program finishes without stopping, first confirm that the correct file is being debugged and that execution reaches the marked line.
At a breakpoint, the Run and Debug view shows several panes that answer different questions:
- Variables shows local variables for the current stack frame. Before
load_namesruns,namesdoes not exist yet; after stepping over that line, it should appear as a list. - Call Stack shows how Python reached the paused line. Select
load_namesafter stepping into it to see that function’s local values, includingfilenameandpath. - Watch lets you add an expression that VS Code reevaluates whenever execution pauses. Add
len(names)afternamesexists, or addpath.exists()while stopped insideload_names. - Breakpoints lets you temporarily disable a stop point without deleting it.
The Debug Console is also a live inspection tool, not merely an output log. While paused after names has been assigned, type these expressions into the console:
names
len(names)
names[0]
They execute in the context of the selected paused frame. That makes the console useful for checking an assumption without editing code to add temporary print() calls. Do not use it to mutate production data casually: assignments and function calls entered there can change the state of the paused program.
Step through code without losing your place
Use F10 for Step Over when you want Python to execute the current line but do not need to enter a called function. On the names = load_names(...) line, F10 runs the entire load_names function and returns to main.
Use F11 for Step Into when the called function is where the problem likely lives. On that same line, F11 opens load_names and pauses at its first executable statement, letting you inspect the incoming filename, the resulting Path, and the contents read from disk.
Shift+F11 is Step Out. It completes the rest of the current function and returns to its caller. F5 resumes execution until the next breakpoint, and Shift+F5 ends the debugging session. On Windows, F9 toggles a breakpoint on the current line, which is faster than using the mouse once you know where execution needs to stop.
The working-folder detail in this example is deliberate. The script reads data/names.txt using a relative path. Relative paths are resolved from the process’s current working directory, not necessarily from the folder containing the script. A script that works from one terminal directory and fails in VS Code is often reporting a working-directory mismatch, not a missing file.
For one-off debugging, VS Code normally uses the opened workspace folder as its working folder. That is appropriate here because data sits directly under the project root. It becomes wrong when an application expects to start from a subfolder, when a command-line tool reads files relative to another directory, or when a script must receive arguments every time it runs.
Save arguments and the working folder in launch.json
Use a launch.json configuration when the debug command needs to be repeatable. Open Run and Debug with Ctrl+Shift+D, select create a launch.json file, choose Python Debugger, then select a Python file configuration. VS Code writes the file to .vscode\launch.json in the workspace.
Replace or add a configuration such as this:
{
    "version": "0.2.0",
    "configurations": [
        {
            "name": "Debug report with sample input",
            "type": "debugpy",
            "request": "launch",
            "program": "${workspaceFolder}/tools/report.py",
            "args": [
                "--input",
                "${workspaceFolder}/samples/orders.csv",
                "--format",
                "summary"
            ],
            "cwd": "${workspaceFolder}/tools",
            "console": "integratedTerminal"
        }
    ]
}
program identifies the script to start. args passes each command-line item as a separate array element; write "--format" and "summary" separately instead of combining them into one string. VS Code substitutes ${workspaceFolder} with the folder you opened, avoiding a hard-coded C:\Users\... path that would break when the project moves to another PC or a coworker clones it elsewhere.
cwd sets the working folder. In the example, code inside tools\report.py can use a relative config.json path that resolves to tools\config.json. Remove cwd or set it to ${workspaceFolder} if the project expects all paths to begin at the repository root.
console determines where program input and output appear. integratedTerminal is generally the right choice for ordinary scripts because it behaves like a terminal and supports input(). The Debug Console remains available for inspecting expressions while paused, but it is not a replacement for interactive standard input.
You usually should not add a fixed "python" path to launch.json. The Python Debugger uses the workspace’s selected interpreter by default, which keeps the configuration portable. Add a python property only when a specific debug configuration intentionally must use a different interpreter than the workspace—for example, when maintaining a legacy utility alongside a newer application.
Fix the failures that look like debugger problems
If the debugger reports ModuleNotFoundError, compare the selected interpreter path with the environment where the package was installed. Run python -m pip show package_name in a fresh VS Code terminal; if it cannot find the package, install it into that selected environment with python -m pip install package_name, not with an unqualified pip command that might target a different Python installation.
If the script cannot find a file, print or inspect Path.cwd() during a breakpoint. The answer exposes whether the failure comes from cwd, a relative path in code, or a workspace opened one folder too high or too low. Fix the configuration or use paths derived from the script location when the program should be independent of its launch folder.
If Python itself is missing from the interpreter list, confirm it works outside VS Code with py --version or python --version in PowerShell, then reload the VS Code window and run Python: Select Interpreter again. Microsoft’s environment tools discover standard Windows installations and workspace virtual environments, but a manually placed interpreter may need its location added through the environment-discovery settings.
The practical result is a debugger setup that is reusable rather than accidental: the selected interpreter defines the packages and Python version, breakpoints expose the program state at the failure point, and launch.json preserves the arguments and starting folder that reproduce the bug.