

.etl trace.Digital Trends framed the announcement as Microsoft teaching AI to uncover bottlenecks inside Windows 11. Microsoft’s own July 30 announcement is both narrower and more useful. WPA MCP is an Early Preview feature in Windows Performance Analyzer, a specialist utility in the Windows Performance Toolkit, and it currently works only with GitHub Copilot and an active GitHub Copilot subscription.
That distinction changes who should pay attention. This is aimed at the people who collect Windows Performance Recorder traces after a slow startup, a driver regression, unexplained battery drain, audio stutter, application hang, or degraded post-logon experience—not ordinary users looking for Copilot to speed up a sluggish laptop.
Windows Performance Analyzer Gets a Copilot Pane
Windows Performance Analyzer, usually shortened to WPA, is Microsoft’s graphical trace-analysis tool. It opens ETW trace files generated by Windows Performance Recorder, Xperf, or other tracing workflows and exposes a sprawling collection of timelines, graphs, pivot tables, call stacks, process activity, I/O data, CPU samples, wait states, and scheduling events.
The tool’s strength has always been detail. Its weakness is that the detail is expensive to interpret. A competent investigator needs to know which recording profile was used, which graph or table answers a particular question, what time range matters, whether symbols are loaded, and how to connect a visible symptom to its underlying process, thread, driver, or hardware event.
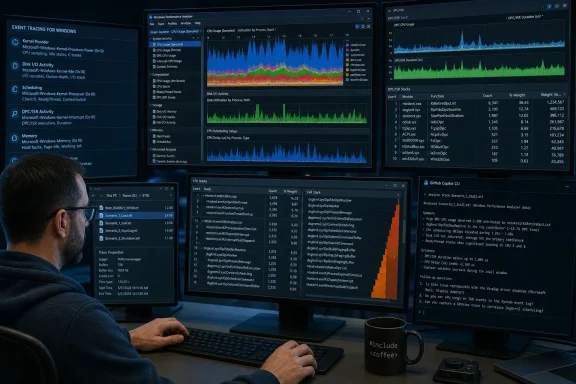
Microsoft’s WPA MCP preview puts GitHub Copilot CLI in that workflow. The user opens a trace in WPA, selects a Copilot control in the upper-right corner, and asks a natural-language question. Microsoft says Copilot can inspect the available trace data, identify the relevant tables and signals, produce a summary, and guide follow-up analysis.
A prompt can be broad—such as asking why a machine felt slow—or narrow: which process added the most delay, what stack consumed the most CPU in a time window, whether a workload was CPU-bound or waiting on disk, or what evidence supports the suspected diagnosis. The useful part is the last one. Microsoft specifically presents evidence review as part of the intended workflow, rather than asking engineers to accept an opaque answer.
This is a meaningful change to WPA’s front door. A senior performance engineer may already know to correlate CPU Usage (Precise), ReadyThread, Disk Usage, DPC/ISR activity, and a process’s stacks. A less frequent user may spend much of an investigation simply locating those views. Copilot can shorten that orientation work.
The AI Does Not Diagnose Windows by Itself
The promotional shorthand—AI finding hidden Windows bottlenecks—risks implying a model that continuously understands the PC. WPA MCP does nothing of the sort. It works from a finite trace collected for a particular reproduction of a problem.
That makes the recording configuration the limiting factor. If a trace does not include the events needed to establish disk I/O, ready-thread delays, DPC activity, stack walks, or a particular provider’s events, no Copilot prompt can reconstruct what was never captured. The assistant may point an engineer toward available evidence, but it cannot compensate for a poor trace or prove a root cause from missing telemetry.
Microsoft’s own WPA documentation makes that clear in a more traditional form: different performance scenarios require different Windows Performance Recorder profiles and different WPA views. High CPU, memory leaks, wait analysis, power issues, and disk activity are not a single data set with one universal answer. The preview lowers the expertise required to start an investigation; it does not remove the need to understand what was captured.
Microsoft also explicitly warns that large-language-model output can vary between runs and may be incomplete or incorrect. Users are told to validate results against the underlying tables, graphs, time ranges, processes, threads, and call stacks before taking action. In performance work, that is not boilerplate. A confident but wrong explanation can send a developer after the application with the highest CPU use when the real delay was a blocked thread, a driver’s deferred procedure calls, an antivirus filter, storage latency, or hardware waking from a low-power state.
The trace remains the record; Copilot is the investigator’s assistant.
WPA MCP Is the Visual Half of a Larger ETW Push
The new WPA preview is also not Microsoft’s only recent attempt to make ETW analysis conversational. On July 21, Microsoft released an early preview of its ETW MCP server, a headless companion intended for terminal-driven, scripted, batch, CI, and IDE-based investigation.
The two tools use the same underlying TraceProcessor and ETW data layer, according to Microsoft. The difference is the interface. ETW MCP works without a WPA window and is designed to process, query, filter, aggregate, compare, and rank traces through an MCP-aware client. WPA MCP is for investigators who want the AI’s explanation tethered to the familiar visual graphs and tables inside the WPA application.
That pairing is the most consequential part of the announcement. A Windows team could use the headless ETW MCP to compare baseline and candidate traces across automated performance tests, then open the difficult case in WPA MCP to inspect the evidence visually. The former makes repetitive performance regression triage more automatable; the latter makes an individual trace less forbidding.
Microsoft’s ETW MCP examples include comparing a baseline trace against a trial run, querying hot symbols, identifying time windows with regressions, and running Critical Path Analysis to find what actually delayed an end-to-end scenario. Those are substantially more valuable uses than asking an assistant to paraphrase Task Manager, because they deal with causality and timing rather than a momentary resource snapshot.
The tools should not be conflated, however. The ETW MCP server supports GitHub Copilot or another MCP-aware AI client, while the July 30 WPA MCP preview supports GitHub Copilot only. Microsoft has not committed to a date for support for other assistants, model providers, or MCP clients inside WPA.
GitHub Copilot Subscription Is a Real Gate
Digital Trends reported that the preview requires GitHub Copilot and an active subscription. Microsoft independently confirms both requirements in the WPA MCP announcement: the current early preview supports GitHub Copilot only, and users need an active GitHub Copilot subscription.
That is an important operational detail for organizations evaluating it. Windows Performance Analyzer itself has long been available through Microsoft’s performance-tooling distribution, but the AI layer is tied to a separate licensed developer service. A team that collects traces through Windows Performance Recorder or already uses WPA will not gain the conversational layer merely by updating its diagnostic toolkit.
The current integration also embeds GitHub Copilot CLI in WPA and loads configured MCP servers alongside it. Microsoft added settings to inspect the WPA MCP server’s read-only tools, control whether it starts with WPA, and disable other configured MCP servers to reduce startup time and context noise. That is a sign of a developer-oriented preview rather than a polished Windows feature intended for every desktop.
Microsoft says the MCP may request permission to access text or JSON files that it generates as part of the workflow. But the announcement does not spell out how trace-derived information, prompts, generated reports, or Copilot responses are handled outside that local permission prompt. Enterprises that treat ETL traces as sensitive diagnostic material should establish that answer with their GitHub Copilot administrators before using production traces.
This Will Not Turn Copilot Into Help Desk Automation
Microsoft is separately rolling out an experimental Copilot on Windows feature called PC insights. That consumer-facing feature can answer questions about current device specifications, CPU usage, storage, battery health, connected hardware, and similar state information after requesting permission. Microsoft says PC insights cannot fix problems, automatically run troubleshooting steps, monitor a device in the background, or access data without approval.
WPA MCP is a different category of tool. PC insights explains the state of a PC at the time of the question. WPA MCP analyzes an intentionally recorded history of what occurred while a performance problem was reproduced. One may tell a user that CPU usage is currently high; the other may help an engineer investigate which threads ran, what they waited on, what call stacks were active, and whether the machine was stalled on code, I/O, scheduling, or a driver.
Neither feature will directly repair a slow machine. WPA MCP’s immediate value is upstream: helping Microsoft, OEMs, driver vendors, enterprise desktop teams, and application developers identify defects before—or after—they create widespread user pain.
For Windows administrators, the next concrete step is modest. Teams already collecting .etl files should test the Windows Performance Analyzer preview on known incidents, compare Copilot’s conclusions with an experienced WPA analysis, and retain the trace and manual evidence for every decision. The preview earns its place only if it reduces the time to a verified explanation without encouraging people to mistake a fluent summary for proof.