Fix Windows 10/11 Storage Spikes: Diagnose 100% Disk Usage with Resource Monitor
Difficulty: Intermediate | Time Required: 20 minutesHigh disk usage spikes (often showing 100% disk in Task Manager) can make Windows 10/11 feel frozen: apps stop responding, Start menu lags, and everything “takes forever.” The good news: you can usually pinpoint the culprit quickly with Resource Monitor, a built-in tool that shows exactly which process is reading/writing your storage, which files it’s touching, and how deep the I/O queue is.
This guide walks you through diagnosing storage spikes and turning what you find into actionable fixes—without installing third-party tools.
Prerequisites
Quick walkthrough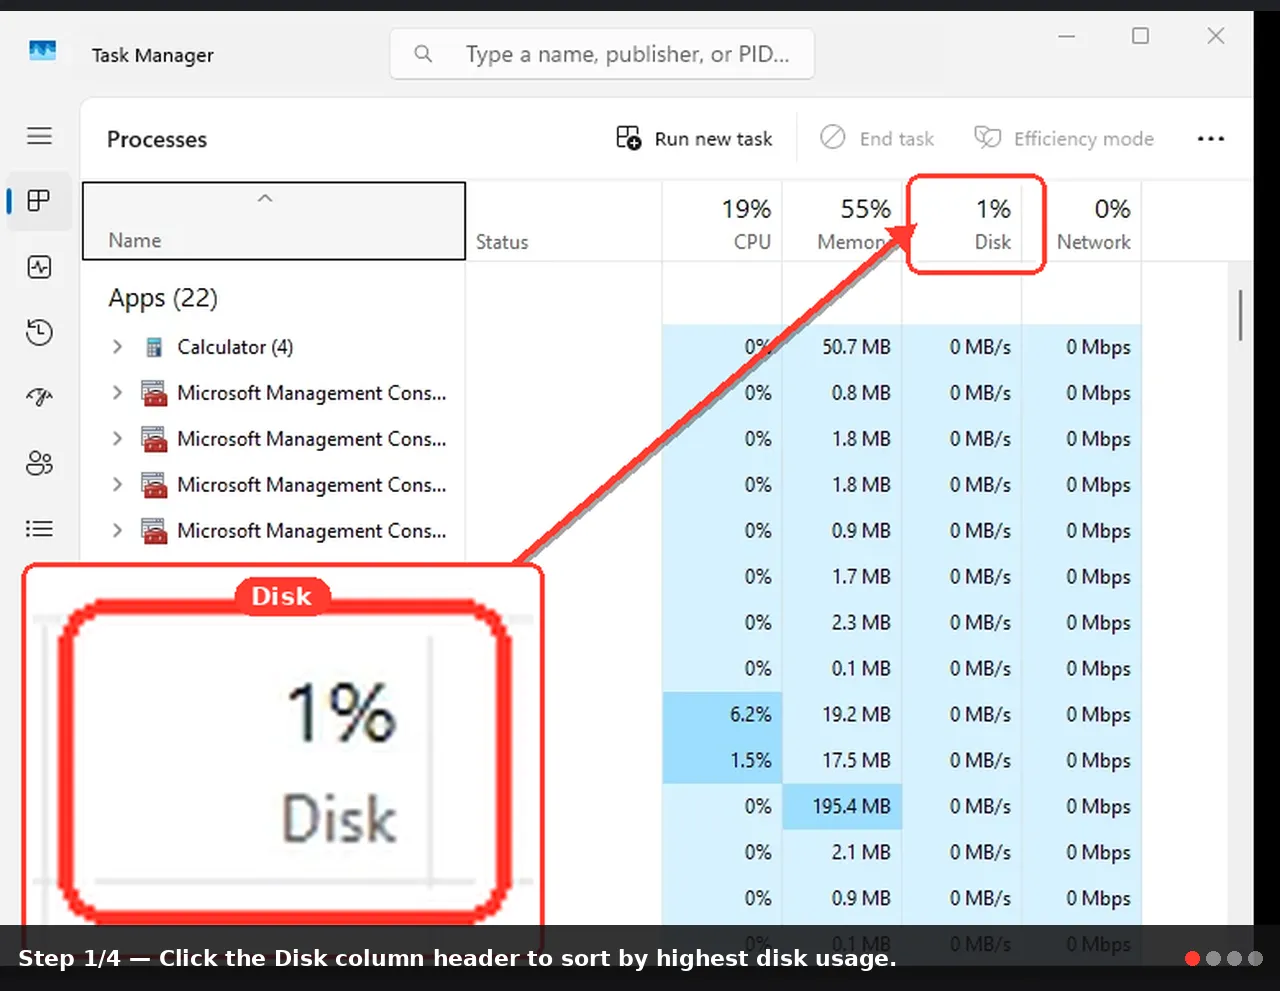
- Windows 10 or Windows 11 (any edition)
- An account with local admin rights is helpful (not always required)
- 5–10 minutes of “problem time” when the disk spike is actively happening (best for accurate diagnosis)
Version note: Resource Monitor exists in both Windows 10 and Windows 11. The path to open it is the same, though Task Manager visuals vary slightly between versions.
Step-by-step: Diagnose 100% Disk Usage with Resource Monitor
1) Confirm it’s really a disk bottleneck (not CPU or RAM)
- Press Ctrl + Shift + Esc to open Task Manager.
- Click More details (if you see the simplified view).
- Go to the Processes tab.
- Click the Disk column header to sort by highest disk usage.
What to look for
- “Disk 100%” combined with sluggishness is a classic sign.
- If Memory is near 90–100% too, you may be paging heavily (which looks like disk saturation). Keep that in mind for later.
Note: Task Manager is great for a quick glance, but it can hide the “why.” Resource Monitor provides the deep view.
2) Open Resource Monitor (the right way)
- In Task Manager, go to the Performance tab.
- Click Open Resource Monitor (usually at the bottom).
- Press Win + R, type:
resmon, then press Enter.
3) Focus on the Disk tab and sort by real I/O
- In Resource Monitor, click the Disk tab.
- In the Processes with Disk Activity panel, click the Total (B/sec) column to sort descending.
- Total (B/sec) = combined reads + writes per process.
- This is more reliable than “% disk” alone when hunting the offender.
Tip: If the spike is intermittent, leave Resource Monitor open and watch the top entries when the slowdown hits.
4) Identify the exact files being hit (often the “aha” moment)
- Still on the Disk tab, look at Disk Activity.
- Sort by Total (B/sec) or Write (B/sec).
- Check the File column to see the path (examples below).
C:\Windows\SoftwareDistribution\...
Often indicates Windows Update activity.C:\ProgramData\Microsoft\Search\Data\...
Points to Windows Search indexing.C:\pagefile.sys
Suggests heavy paging (RAM pressure) or a memory-hungry app.- Your browser cache folders (Chrome/Edge profiles)
Could be heavy caching, downloads, or extensions. - Antivirus quarantine/temp scanning locations
Real-time scanning can cause bursts.
Warning: Don’t delete system files because you see them listed. Use the path as a diagnostic clue, then apply a safe fix.
5) Check “Storage queue” symptoms: Disk Queue Length
- On the Disk tab, find the Storage panel (bottom).
- Look at Disk Queue Length while the system is slow.
- Queue Length consistently above 2 (especially on an SSD) while the PC is lagging often means the storage subsystem is backlogged.
- On older HDDs, high queue lengths are more common during heavy operations—but sustained high values during “normal use” still indicate a problem process or failing drive.
Note: A brief spike is normal. Sustained queuing + sluggishness is the red flag.
6) Correlate with CPU, RAM, and handles (quick cross-check)
Resource Monitor lets you cross-check without leaving the tool:- Click the CPU tab and look at Processes (sort by CPU).
- Click the Memory tab and check high usage processes.
- Return to Disk and see if the same process appears at the top.
- A process can trigger disk activity because it’s:
- Using too much memory → paging to disk
- Stuck in a loop → logging or temp file writes
- Scanning files → antivirus or indexing
7) Narrow it down with the checkbox filter (built-in “spotlight”)
- On the Disk tab, in Processes with Disk Activity, check the box next to the top suspect process.
- Watch how Disk Activity and Associated Handles filter down to that process.
- Which files it’s touching
- Whether it’s mostly reads vs writes
- Whether multiple processes are involved
8) Apply targeted fixes based on what you find
Below are safe, common fixes depending on the patterns Resource Monitor reveals.A) Windows Update is hammering the disk
Clue: Files inC:\Windows\SoftwareDistribution\...- Let it finish if it’s actively updating (often resolves itself).
- If it’s stuck for hours, run Windows Update troubleshooter:
- Settings → System → Troubleshoot → Other troubleshooters
- Run Windows Update troubleshooter
- Reboot and re-check Resource Monitor.
Tip: Update activity frequently causes short-lived spikes after a fresh install or feature update.
B) Search Indexer is saturating the drive
Clue:Microsoft\Search\Data\... or SearchIndexer.exe- Reduce indexing scope:
- Open Settings
- Search for Indexing Options
- Click Modify and uncheck large folders/drives you don’t need indexed (e.g., game libraries, huge archives)
Note: After major file changes, indexing spikes are normal—especially on HDDs.
C) Pagefile.sys dominates (paging due to low RAM or runaway app)
Clue:pagefile.sys at top + high Memory usage- Close the offending app/process and re-check.
- Reduce startup load:
- Task Manager → Startup apps
- Disable non-essential items
- Consider adding RAM if you commonly hit high memory usage.
Warning: Don’t disable the pagefile unless you know exactly why; it can cause instability or crashes.
D) Antivirus/EDR scanning is causing bursts
Clue: Defender/AV processes + lots of file reads- Let initial scans finish.
- Schedule scans for off-hours.
- Add exclusions carefully for trusted large folders (e.g., massive game libraries), if appropriate.
Security note: Avoid excluding system folders or downloads folders—this reduces protection.
E) Suspicious or unknown process with heavy disk writes
Clue: Randomly named process, heavy writes to temp locations- Right-click the process in Task Manager → Open file location
- Run a Microsoft Defender Offline scan:
- Windows Security → Virus & threat protection
- Scan options → Microsoft Defender Offline scan
Tips and troubleshooting notes (when the spike won’t cooperate)
- Reproduce the slowdown: Open the apps you normally use when it happens (browser + mail + file sync), then watch Resource Monitor.
- Check if it’s one drive or all drives: In the Storage panel, confirm which disk is queuing (Disk 0 vs Disk 1).
- HDD vs SSD matters: HDDs are far more sensitive to background indexing, updates, and AV scans.
- Don’t confuse disk “Active time” with throughput: You can have 100% active time with relatively low MB/s if I/O is lots of small random reads/writes (common with HDDs and some background tasks).
- Hardware health check (optional but smart): If queue length is high and performance is degrading over time, consider checking SMART status with your drive vendor tool or Windows
wmic diskdrive get status(quick but not very detailed).
Warning: If you hear clicking/grinding on an HDD or see frequent freezes paired with errors in Event Viewer, back up your data immediately—failing drives can present as persistent 100% disk usage.
Conclusion
Resource Monitor is one of the fastest ways to turn “my disk is at 100%” into a concrete answer: which process, which files, and whether the storage queue is overloaded. With that evidence, you can apply the correct fix—whether it’s Windows Update finishing up, indexing tuning, antivirus scan timing, or addressing memory pressure and paging.Key Takeaways:
- Use Resource Monitor → Disk to identify the real process and file paths behind 100% disk usage.
- Disk Queue Length helps confirm when storage is genuinely backlogged (not just a misleading percentage).
- The most common causes are Windows Update, Search indexing, paging (pagefile.sys), and security scans—each with a targeted, safe remedy.
This tutorial was generated to help WindowsForum.com users get the most out of their Windows experience.
Last edited: