spogglenose

New Member
Joined
Dec 1, 2010
Messages
16
Hi there

I have just got a brand new laptop (MSI GX660R) delivered 1 week ago and literally from day one it has had random crashes. It is very strange though because the crashes only seem to happen when I am watching a video on tudou.com but not youtube. Basically after watching for about 10 mins a blue screen comes up and it restarts too quickly for me to red what it says has gone wrong. I have updated the graphics driver since I thought it was a graphics issue due to the fact that one crash and restart gave me windows in low res which crashed again about 10 seconds after I logged in anf then went back to normal :confused:. Anyway here is the dump files created and the error codes from when it says windows recovered from an unexpected shutdown. Thanks in advance for any help with this weird problem

Problem signature:
Problem Event Name: BlueScreen
OS Version: 6.1.7600.2.0.0.768.3
Locale ID: 2057

Additional information about the problem:
BCCode: 1000007e
BCP1: FFFFFFFFC0000005
BCP2: FFFFF880010F5523
BCP3: FFFFF88003748778
BCP4: FFFFF88003747FE0
OS Version: 6_1_7600
Service Pack: 0_0
Product: 768_1


Attachments

Solution
Hello,

I think it's a good idea to run a Video Stress Test since few crashes are pointing to ATI Display drivers as well

FurMark: Graphics Card Stability and Stress Test, OpenGL Benchmark and GPU Temperature | oZone3D.Net


FurMark Setup:
- If you have more than one GPU, select Multi-GPU during setup
- In the Run mode box, select "Stability Test" and "Log GPU Temperature"
Click "Go" to start the test
- Run the test until the GPU temperature maxes out - or until you start having problems (whichever comes first).
- Click "Quit" to exit

Try this free stress test: Free Software - GIMPS


Prime95 Setup:
- extract the contents of the...
Hi there, welcome.

Please post a screen shot of CPU-Z spd and memory tabs. You can attach the jpegs directly. There is likely a bios setting or a few, unwell.

For now, also update Realtek lan driver:

Rt64win7 Rt64win7.sys Fri Nov 27 04:45:07 2009

Link Removed


Thanks for the fast response! I'm not sure how to find out the CPU-Z spd and mem tabs but ill update the realtek driver asap.


Thanks for the link

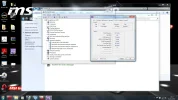
Attached are the JPEG's and in them you should be able to see the device manager with the realtek network adapter shown which I updated assuming that it is the LAN one. If not then where can I find it. I know some stuff but obviously my knowledge is very lacking lol.


Attachments

  • Mem.webp
    Mem.webp
    126.8 KB · Views: 1,151
  • SPD.webp
    SPD.webp
    132.5 KB · Views: 473
Right on, memory is set completely wrong in the bios.

Go there and Load the Optimized Defaults. Post a new screen shot of the memory tab. Hopefully it will be set well then and if not, you'll have to configure it manually.


So restart and go into bios to load optimised defaults. Awsome I will give this a try right away.


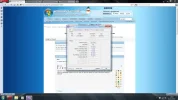
Ok then thats all done and here is the mem tab. Was worried for a second as it came up with no operating system found and was only on the 4th boot location that windows loaded!!


Attachments

  • Mem take 2.webp
    Mem take 2.webp
    105.6 KB · Views: 540
Hello,

I think it's a good idea to run a Video Stress Test since few crashes are pointing to ATI Display drivers as well

FurMark: Graphics Card Stability and Stress Test, OpenGL Benchmark and GPU Temperature | oZone3D.Net


FurMark Setup:
- If you have more than one GPU, select Multi-GPU during setup
- In the Run mode box, select "Stability Test" and "Log GPU Temperature"
Click "Go" to start the test
- Run the test until the GPU temperature maxes out - or until you start having problems (whichever comes first).
- Click "Quit" to exit

Try this free stress test: Free Software - GIMPS


Prime95 Setup:
- extract the contents of the zip file to a location of your choice
- double click on the executable file
- select "Just stress testing"
- select the "Blend" test. If you've already run MemTest overnight you may want to run the "Small FFTs" test instead.
- "Number of torture test threads to run" should equal the number of CPU's times 2 (if you're using hyperthreading).
The easiest way to figure this out is to go to Task Manager...Performance tab - and see the number of boxes under CPU Usage History
Then run the test for 6 to 24 hours - or until you get errors (whichever comes first).
The Test selection box and the stress.txt file describes what components that the program stresses.

Bughceck:

Code:
SYSTEM_THREAD_EXCEPTION_NOT_HANDLED_M (1000007e)
This is a very common bugcheck.  Usually the exception address pinpoints
the driver/function that caused the problem.  Always note this address
as well as the link date of the driver/image that contains this address.
Some common problems are exception code 0x80000003.  This means a hard
coded breakpoint or assertion was hit, but this system was booted
/NODEBUG.  This is not supposed to happen as developers should never have
hardcoded breakpoints in retail code, but ...
If this happens, make sure a debugger gets connected, and the
system is booted /DEBUG.  This will let us see why this breakpoint is
happening.
Arguments:
Arg1: ffffffffc0000005, The exception code that was not handled
Arg2: fffff88005a89cad, The address that the exception occurred at
Arg3: fffff880079059b8, Exception Record Address
Arg4: fffff88007905220, Context Record Address

Debugging Details:
------------------


EXCEPTION_CODE: (NTSTATUS) 0xc0000005 - The instruction at "0x%08lx" referenced memory at "0x%08lx". The memory could not be "%s".

FAULTING_IP: 
atikmdag+267cad
fffff880`05a89cad 48894808        mov     qword ptr [rax+8],rcx

EXCEPTION_RECORD:  fffff880079059b8 -- (.exr 0xfffff880079059b8)
ExceptionAddress: fffff88005a89cad (atikmdag+0x0000000000267cad)
   ExceptionCode: c0000005 (Access violation)
  ExceptionFlags: 00000000
NumberParameters: 2
   Parameter[0]: 0000000000000000
   Parameter[1]: ffffffffffffffff
Attempt to read from address ffffffffffffffff

CONTEXT:  fffff88007905220 -- (.cxr 0xfffff88007905220)
rax=57fd3a610b3358f4 rbx=0000000000000000 rcx=fffffa8009a4a8b0
rdx=fffffa8009a4a740 rsi=0000000000000004 rdi=0000000000000000
rip=fffff88005a89cad rsp=fffff88007905bf8 rbp=cccccccccccccccd
 r8=fffffa8009a43020  r9=0000000000000140 r10=fffffa8009a4a740
r11=0000000000000000 r12=00003474d4d0ac6f r13=0000000000002f8c
r14=0000000000000020 r15=0000000000000000
iopl=0         nv up ei pl nz na pe nc
cs=0010  ss=0018  ds=002b  es=002b  fs=0053  gs=002b             efl=00010202
atikmdag+0x267cad:
fffff880`05a89cad 48894808        mov     qword ptr [rax+8],rcx ds:002b:57fd3a61`0b3358fc=????????????????
Resetting default scope

CUSTOMER_CRASH_COUNT:  1

DEFAULT_BUCKET_ID:  VISTA_DRIVER_FAULT

PROCESS_NAME:  System

CURRENT_IRQL:  0

ERROR_CODE: (NTSTATUS) 0xc0000005 - The instruction at "0x%08lx" referenced memory at "0x%08lx". The memory could not be "%s".

EXCEPTION_PARAMETER1:  0000000000000000

EXCEPTION_PARAMETER2:  ffffffffffffffff

READ_ADDRESS: GetPointerFromAddress: unable to read from fffff800030c50e0
 ffffffffffffffff 

FOLLOWUP_IP: 
atikmdag+267cad
fffff880`05a89cad 48894808        mov     qword ptr [rax+8],rcx

BUGCHECK_STR:  0x7E

LAST_CONTROL_TRANSFER:  from fffff88005a89e47 to fffff88005a89cad

STACK_TEXT:  
fffff880`07905bf8 fffff880`05a89e47 : fffffa80`09a57670 fffff880`05df65a0 00000000`00000027 00000000`00001f38 : atikmdag+0x267cad
fffff880`07905c00 fffffa80`09a57670 : fffff880`05df65a0 00000000`00000027 00000000`00001f38 00000000`000041ed : atikmdag+0x267e47
fffff880`07905c08 fffff880`05df65a0 : 00000000`00000027 00000000`00001f38 00000000`000041ed fffff880`05a873f2 : 0xfffffa80`09a57670
fffff880`07905c10 00000000`00000027 : 00000000`00001f38 00000000`000041ed fffff880`05a873f2 fffff880`05df65a0 : atikmdag+0x5d45a0
fffff880`07905c18 00000000`00001f38 : 00000000`000041ed fffff880`05a873f2 fffff880`05df65a0 cccccccc`cccccccd : 0x27
fffff880`07905c20 00000000`000041ed : fffff880`05a873f2 fffff880`05df65a0 cccccccc`cccccccd 00000000`00000004 : 0x1f38
fffff880`07905c28 fffff880`05a873f2 : fffff880`05df65a0 cccccccc`cccccccd 00000000`00000004 00000000`00000000 : 0x41ed
fffff880`07905c30 fffff880`05df65a0 : cccccccc`cccccccd 00000000`00000004 00000000`00000000 fffff880`03163180 : atikmdag+0x2653f2
fffff880`07905c38 cccccccc`cccccccd : 00000000`00000004 00000000`00000000 fffff880`03163180 00000000`00004d78 : atikmdag+0x5d45a0
fffff880`07905c40 00000000`00000004 : 00000000`00000000 fffff880`03163180 00000000`00004d78 0000000e`0000017c : 0xcccccccc`cccccccd
fffff880`07905c48 00000000`00000000 : fffff880`03163180 00000000`00004d78 0000000e`0000017c 00000003`00002f8c : 0x4


SYMBOL_STACK_INDEX:  0

SYMBOL_NAME:  atikmdag+267cad

FOLLOWUP_NAME:  MachineOwner

MODULE_NAME: atikmdag

IMAGE_NAME:  atikmdag.sys

DEBUG_FLR_IMAGE_TIMESTAMP:  4c21766c

STACK_COMMAND:  .cxr 0xfffff88007905220 ; kb

FAILURE_BUCKET_ID:  X64_0x7E_atikmdag+267cad

BUCKET_ID:  X64_0x7E_atikmdag+267cad

Followup: MachineOwner


Hope this helps,
Captain


Solution
Hello,

I think it's a good idea to run a Video Stress Test since few crashes are pointing to ATI Display drivers as well

FurMark: Graphics Card Stability and Stress Test, OpenGL Benchmark and GPU Temperature | oZone3D.Net


FurMark Setup:
- If you have more than one GPU, select Multi-GPU during setup
- In the Run mode box, select "Stability Test" and "Log GPU Temperature"
Click "Go" to start the test
- Run the test until the GPU temperature maxes out - or until you start having problems (whichever comes first).
- Click "Quit" to exit

Try this free stress test: Free Software - GIMPS


Prime95 Setup:
- extract the contents of the zip file to a location of your choice
- double click on the executable file
- select "Just stress testing"
- select the "Blend" test. If you've already run MemTest overnight you may want to run the "Small FFTs" test instead.
- "Number of torture test threads to run" should equal the number of CPU's times 2 (if you're using hyperthreading).
The easiest way to figure this out is to go to Task Manager...Performance tab - and see the number of boxes under CPU Usage History
Then run the test for 6 to 24 hours - or until you get errors (whichever comes first).
The Test selection box and the stress.txt file describes what components that the program stresses.

Bughceck:

Code:
SYSTEM_THREAD_EXCEPTION_NOT_HANDLED_M (1000007e)
This is a very common bugcheck.  Usually the exception address pinpoints
the driver/function that caused the problem.  Always note this address
as well as the link date of the driver/image that contains this address.
Some common problems are exception code 0x80000003.  This means a hard
coded breakpoint or assertion was hit, but this system was booted
/NODEBUG.  This is not supposed to happen as developers should never have
hardcoded breakpoints in retail code, but ...
If this happens, make sure a debugger gets connected, and the
system is booted /DEBUG.  This will let us see why this breakpoint is
happening.
Arguments:
Arg1: ffffffffc0000005, The exception code that was not handled
Arg2: fffff88005a89cad, The address that the exception occurred at
Arg3: fffff880079059b8, Exception Record Address
Arg4: fffff88007905220, Context Record Address

Debugging Details:
------------------


EXCEPTION_CODE: (NTSTATUS) 0xc0000005 - The instruction at "0x%08lx" referenced memory at "0x%08lx". The memory could not be "%s".

FAULTING_IP: 
atikmdag+267cad
fffff880`05a89cad 48894808        mov     qword ptr [rax+8],rcx

EXCEPTION_RECORD:  fffff880079059b8 -- (.exr 0xfffff880079059b8)
ExceptionAddress: fffff88005a89cad (atikmdag+0x0000000000267cad)
   ExceptionCode: c0000005 (Access violation)
  ExceptionFlags: 00000000
NumberParameters: 2
   Parameter[0]: 0000000000000000
   Parameter[1]: ffffffffffffffff
Attempt to read from address ffffffffffffffff

CONTEXT:  fffff88007905220 -- (.cxr 0xfffff88007905220)
rax=57fd3a610b3358f4 rbx=0000000000000000 rcx=fffffa8009a4a8b0
rdx=fffffa8009a4a740 rsi=0000000000000004 rdi=0000000000000000
rip=fffff88005a89cad rsp=fffff88007905bf8 rbp=cccccccccccccccd
 r8=fffffa8009a43020  r9=0000000000000140 r10=fffffa8009a4a740
r11=0000000000000000 r12=00003474d4d0ac6f r13=0000000000002f8c
r14=0000000000000020 r15=0000000000000000
iopl=0         nv up ei pl nz na pe nc
cs=0010  ss=0018  ds=002b  es=002b  fs=0053  gs=002b             efl=00010202
atikmdag+0x267cad:
fffff880`05a89cad 48894808        mov     qword ptr [rax+8],rcx ds:002b:57fd3a61`0b3358fc=????????????????
Resetting default scope

CUSTOMER_CRASH_COUNT:  1

DEFAULT_BUCKET_ID:  VISTA_DRIVER_FAULT

PROCESS_NAME:  System

CURRENT_IRQL:  0

ERROR_CODE: (NTSTATUS) 0xc0000005 - The instruction at "0x%08lx" referenced memory at "0x%08lx". The memory could not be "%s".

EXCEPTION_PARAMETER1:  0000000000000000

EXCEPTION_PARAMETER2:  ffffffffffffffff

READ_ADDRESS: GetPointerFromAddress: unable to read from fffff800030c50e0
 ffffffffffffffff 

FOLLOWUP_IP: 
atikmdag+267cad
fffff880`05a89cad 48894808        mov     qword ptr [rax+8],rcx

BUGCHECK_STR:  0x7E

LAST_CONTROL_TRANSFER:  from fffff88005a89e47 to fffff88005a89cad

STACK_TEXT:  
fffff880`07905bf8 fffff880`05a89e47 : fffffa80`09a57670 fffff880`05df65a0 00000000`00000027 00000000`00001f38 : atikmdag+0x267cad
fffff880`07905c00 fffffa80`09a57670 : fffff880`05df65a0 00000000`00000027 00000000`00001f38 00000000`000041ed : atikmdag+0x267e47
fffff880`07905c08 fffff880`05df65a0 : 00000000`00000027 00000000`00001f38 00000000`000041ed fffff880`05a873f2 : 0xfffffa80`09a57670
fffff880`07905c10 00000000`00000027 : 00000000`00001f38 00000000`000041ed fffff880`05a873f2 fffff880`05df65a0 : atikmdag+0x5d45a0
fffff880`07905c18 00000000`00001f38 : 00000000`000041ed fffff880`05a873f2 fffff880`05df65a0 cccccccc`cccccccd : 0x27
fffff880`07905c20 00000000`000041ed : fffff880`05a873f2 fffff880`05df65a0 cccccccc`cccccccd 00000000`00000004 : 0x1f38
fffff880`07905c28 fffff880`05a873f2 : fffff880`05df65a0 cccccccc`cccccccd 00000000`00000004 00000000`00000000 : 0x41ed
fffff880`07905c30 fffff880`05df65a0 : cccccccc`cccccccd 00000000`00000004 00000000`00000000 fffff880`03163180 : atikmdag+0x2653f2
fffff880`07905c38 cccccccc`cccccccd : 00000000`00000004 00000000`00000000 fffff880`03163180 00000000`00004d78 : atikmdag+0x5d45a0
fffff880`07905c40 00000000`00000004 : 00000000`00000000 fffff880`03163180 00000000`00004d78 0000000e`0000017c : 0xcccccccc`cccccccd
fffff880`07905c48 00000000`00000000 : fffff880`03163180 00000000`00004d78 0000000e`0000017c 00000003`00002f8c : 0x4


SYMBOL_STACK_INDEX:  0

SYMBOL_NAME:  atikmdag+267cad

FOLLOWUP_NAME:  MachineOwner

MODULE_NAME: atikmdag

IMAGE_NAME:  atikmdag.sys

DEBUG_FLR_IMAGE_TIMESTAMP:  4c21766c

STACK_COMMAND:  .cxr 0xfffff88007905220 ; kb

FAILURE_BUCKET_ID:  X64_0x7E_atikmdag+267cad

BUCKET_ID:  X64_0x7E_atikmdag+267cad

Followup: MachineOwner


Hope this helps,
Captain

Hi there

Thanks for the extra advice! Just wondering there is only a 32 bit version of FurMark and I have 64bit. Is that an issue or should I just go ahead?


You have to set the RAM manually in the bios with the specs 667 MHz, 9-9-9-24 timings then save.

There's nothing wrong with video.

Those video crashes are caused by improper bios settings as shown above.


You have to set the RAM manually in the bios with the specs 667 MHz, 9-9-9-24 timings then save.

There's nothing wrong with video.

Ok I will try the memory change first as its quicker then a 6 hour stress test. How do I change the RAM in the BIOS as I couldnt find any option for memory in it just the load optimal defauts.


Seems you can not adjust the memory settings on that model, as I just checked the manual. I would run Memtest86+ on it 8-10 passes to see if errors show.

If any do, you have no choice but to return the machine to the retailer or MSI for replacement or refund.


Ok thanks very much for all the help. It is running Memtest now and I will report back the results.


Back
Top